
ICO Workshop R & RStudio
Part 5
Statistical analyses in R
2nd - 4th July, 2024
Overview
- Correlation --- (Click here)
- t-test --- (Click here)
- Linear regression --- (Click here)
1. Correlation
The cor( ) function

Watch out for NA's!!
library(palmerpenguins)data("penguins")cor(penguins$flipper_length_mm, penguins$body_mass_g)## [1] NAcor(penguins$flipper_length_mm, penguins$body_mass_g, use = "complete.obs")## [1] 0.8712018Statistical tests with cor.test( )
cor.test(penguins$flipper_length_mm, penguins$body_mass_g)## ## Pearson's product-moment correlation## ## data: penguins$flipper_length_mm and penguins$body_mass_g## t = 32.722, df = 340, p-value < 2.2e-16## alternative hypothesis: true correlation is not equal to 0## 95 percent confidence interval:## 0.843041 0.894599## sample estimates:## cor ## 0.8712018
The broom package
Package in
tidyverseCreates tibbles based on results from a statistical analysis!
tidy(): output from an analysis as a tibble
library(broom)C <- cor.test(penguins$flipper_length_mm, penguins$body_mass_g)tidy(C)## # A tibble: 1 × 8## estimate statistic p.value parameter conf.low conf.high method alternative## <dbl> <dbl> <dbl> <int> <dbl> <dbl> <chr> <chr> ## 1 0.871 32.7 4.37e-107 340 0.843 0.895 Pearson… two.sidedCorrelation between multiple variabeles
penguins %>% select( bill_depth_mm, bill_length_mm, flipper_length_mm, body_mass_g ) %>% cor(use = "pairwise.complete.obs")## bill_depth_mm bill_length_mm flipper_length_mm body_mass_g## bill_depth_mm 1.0000000 -0.2350529 -0.5838512 -0.4719156## bill_length_mm -0.2350529 1.0000000 0.6561813 0.5951098## flipper_length_mm -0.5838512 0.6561813 1.0000000 0.8712018## body_mass_g -0.4719156 0.5951098 0.8712018 1.0000000Correlations between multiple variabeles visualized
Package: GGally
Function: ggpairs()
Result: a ggplot object...
library(GGally)penguins %>% select( species, bill_depth_mm, bill_length_mm, flipper_length_mm, body_mass_g ) %>% ggpairs( columns = c( "flipper_length_mm", "body_mass_g", "bill_length_mm", "bill_depth_mm") )
Correlations between multiple variabeles visualized WITH COLOR!
penguins %>% select( species, bill_depth_mm, bill_length_mm, flipper_length_mm, body_mass_g ) %>% ggpairs( aes(color = species), columns = c( "flipper_length_mm", "body_mass_g", "bill_length_mm", "bill_depth_mm")) + scale_colour_manual( values = c("darkorange","purple","cyan4")) + scale_fill_manual( values = c("darkorange","purple","cyan4"))
2. t-test
First some descriptives
Compare Gentoo with Adelie penguins on body_mass_g
library(kableExtra)penguins %>% select( species, body_mass_g ) %>% filter( species == 'Adelie' | species == 'Gentoo' ) %>% group_by(species) %>% summarize( count = n(), mean = mean(body_mass_g, na.rm = TRUE), sd = sd(body_mass_g, na.rm = TRUE) ) %>% kable()| species | count | mean | sd |
|---|---|---|---|
| Adelie | 152 | 3700.662 | 458.5661 |
| Gentoo | 124 | 5076.016 | 504.1162 |
Create boxplots with ggpubr package
# install.packages(ggpubr)library(ggpubr)penguins %>% select( species, body_mass_g ) %>% filter( species == 'Adelie' | species == 'Gentoo' ) %>% ggboxplot( x = "species", y = "body_mass_g", color = "species", palette = c("#00AFBB", "#E7B800"), ylab = "Body Mass (g)", xlab = "Species")
Checking the assumptions of equal variances with var.test() function
p <- penguins %>% select( species, body_mass_g ) %>% filter( species == 'Adelie' | species == 'Gentoo' )var.test(body_mass_g ~ species, data= p)## ## F test to compare two variances## ## data: body_mass_g by species## F = 0.82745, num df = 150, denom df = 122, p-value = 0.2691## alternative hypothesis: true ratio of variances is not equal to 1## 95 percent confidence interval:## 0.5875588 1.1583164## sample estimates:## ratio of variances ## 0.8274515Perform unpaired t-test with t.test() function
p <- penguins %>% select( species, body_mass_g ) %>% filter( species == 'Adelie' | species == 'Gentoo' )t.test(body_mass_g ~ species, data= p, var.equal = TRUE)## ## Two Sample t-test## ## data: body_mass_g by species## t = -23.614, df = 272, p-value < 2.2e-16## alternative hypothesis: true difference in means between group Adelie and group Gentoo is not equal to 0## 95 percent confidence interval:## -1490.021 -1260.687## sample estimates:## mean in group Adelie mean in group Gentoo ## 3700.662 5076.0163. Linear regression
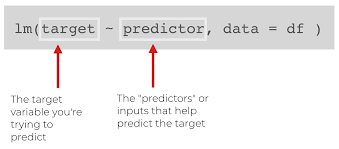
lm()

Model1 <- lm(flipper_length_mm ~ body_mass_g, data = penguins)Model results with summary()
summary(Model1)## ## Call:## lm(formula = flipper_length_mm ~ body_mass_g, data = penguins)## ## Residuals:## Min 1Q Median 3Q Max ## -23.7626 -4.9138 0.9891 5.1166 16.6392 ## ## Coefficients:## Estimate Std. Error t value Pr(>|t|) ## (Intercept) 1.367e+02 1.997e+00 68.47 <2e-16 ***## body_mass_g 1.528e-02 4.668e-04 32.72 <2e-16 ***## ---## Signif. codes: 0 '***' 0.001 '**' 0.01 '*' 0.05 '.' 0.1 ' ' 1## ## Residual standard error: 6.913 on 340 degrees of freedom## (2 observations deleted due to missingness)## Multiple R-squared: 0.759, Adjusted R-squared: 0.7583 ## F-statistic: 1071 on 1 and 340 DF, p-value: < 2.2e-16
The broom package
Function: tidy()
Result: tidy dataset with information on parameter estimates
tidy(Model1, conf.int = TRUE, conf.level = .90)## # A tibble: 2 × 7## term estimate std.error statistic p.value conf.low conf.high## <chr> <dbl> <dbl> <dbl> <dbl> <dbl> <dbl>## 1 (Intercept) 137. 2.00 68.5 5.71e-201 133. 140. ## 2 body_mass_g 0.0153 0.000467 32.7 4.37e-107 0.0145 0.0160
The broom package + kable()
tidy(Model1, conf.int = TRUE, conf.level = .90) %>% kable()| term | estimate | std.error | statistic | p.value | conf.low | conf.high |
|---|---|---|---|---|---|---|
| (Intercept) | 136.7295593 | 1.9968354 | 68.47312 | 0 | 133.4360836 | 140.0230350 |
| body_mass_g | 0.0152759 | 0.0004668 | 32.72223 | 0 | 0.0145059 | 0.0160459 |

The broom package
Function: glance()
Result: tidy dataset with information on model fit
glance(Model1)## # A tibble: 1 × 12## r.squared adj.r.squared sigma statistic p.value df logLik AIC BIC## <dbl> <dbl> <dbl> <dbl> <dbl> <dbl> <dbl> <dbl> <dbl>## 1 0.759 0.758 6.91 1071. 4.37e-107 1 -1146. 2297. 2309.## # ℹ 3 more variables: deviance <dbl>, df.residual <int>, nobs <int>
The broom package
Function: augment()
Result: add information to the dataset based on the model like fitted values, residuals, ...
augment(Model1)## # A tibble: 342 × 9## .rownames flipper_length_mm body_mass_g .fitted .resid .hat .sigma .cooksd## <chr> <int> <int> <dbl> <dbl> <dbl> <dbl> <dbl>## 1 1 181 3750 194. -13.0 0.00385 6.89 6.88e-3## 2 2 186 3800 195. -8.78 0.00366 6.91 2.97e-3## 3 3 195 3250 186. 8.62 0.00705 6.91 5.57e-3## 4 5 193 3450 189. 3.57 0.00550 6.92 7.41e-4## 5 6 190 3650 192. -2.49 0.00431 6.92 2.81e-4## 6 7 181 3625 192. -11.1 0.00444 6.90 5.78e-3## 7 8 195 4675 208. -13.1 0.00395 6.89 7.19e-3## 8 9 193 3475 190. 3.19 0.00533 6.92 5.73e-4## 9 10 190 4250 202. -11.7 0.00293 6.89 4.19e-3## 10 11 186 3300 187. -1.14 0.00663 6.92 9.14e-5## # ℹ 332 more rows## # ℹ 1 more variable: .std.resid <dbl>
The broom package to check some assumptions
Functions: augment() + geom_histogram()
Result: Are the residuals normally distributed?
augment(Model1) %>% select(.resid) %>% ggplot( aes( x = .resid ) ) + geom_histogram() + theme_minimal() + labs( title = "Model1", subtitle = "Distribution of residuals" ) + theme(plot.title.position = "plot")

The broom package to check some assumptions
Functions: augment() + geom_point()
Resultaat: Homoscedasticity?
augment(Model1) %>% select(.fitted, .std.resid) %>% ggplot( aes( x = .fitted, y = .std.resid ) ) + geom_point() + theme_minimal() + labs( title = "Model1", subtitle = "Fitted values vs residuals" ) + geom_hline(yintercept = 0) + theme(plot.title.position = "plot")

broom package to visualise model results
Functions: augment() + geom_line()
Result: Plot of the fitted regression model (the line)
augment(Model1) %>% select(.fitted, body_mass_g) %>% ggplot( aes( x = body_mass_g, y = .fitted ) ) + geom_line() + theme_minimal() + labs( title = "Model1", subtitle = "Fitted values based on body mass", x = "body mass (g)", y = "fitted values" ) + theme(plot.title.position = "plot")
Multivariate regression
Model2 <- lm( flipper_length_mm ~ body_mass_g + sex + species, data = penguins)tidy(Model2) %>% kable()| term | estimate | std.error | statistic | p.value |
|---|---|---|---|---|
| (Intercept) | 164.5887169 | 3.1836146 | 51.698694 | 0.0000000 |
| body_mass_g | 0.0065499 | 0.0009308 | 7.036742 | 0.0000000 |
| sexmale | 2.4777215 | 0.8540581 | 2.901116 | 0.0039696 |
| speciesChinstrap | 5.5444400 | 0.7852051 | 7.061136 | 0.0000000 |
| speciesGentoo | 18.0213174 | 1.4424942 | 12.493165 | 0.0000000 |
Model comparison
Model fit of multiple models:
M1_info <- glance(Model1) %>% select(r.squared, AIC, BIC)M2_info <- glance(Model2) %>% select(r.squared, AIC, BIC)M1_info %>% rbind(M2_info) %>% kable()| r.squared | AIC | BIC |
|---|---|---|
| 0.7589925 | 2297.035 | 2308.540 |
| 0.8562944 | 2068.357 | 2091.206 |
Visualize this model
augment(Model2) %>% ggplot() + geom_point( aes(x = body_mass_g, y = flipper_length_mm, color = sex), alpha = .6 ) + geom_line( aes( x = body_mass_g, y = .fitted, color = sex, ), size = 1.5 ) + facet_wrap(.~species) + theme_minimal()
Some cool stuff with the sjplot package
For instance, create an html-table with the estimates of two models: Model1 & Model2
Function: tab_model()
library(sjPlot)tab_model(Model1, Model2)| flipper length mm | flipper length mm | |||||
|---|---|---|---|---|---|---|
| Predictors | Estimates | CI | p | Estimates | CI | p |
| (Intercept) | 136.73 | 132.80 – 140.66 | <0.001 | 164.59 | 158.33 – 170.85 | <0.001 |
| body mass g | 0.02 | 0.01 – 0.02 | <0.001 | 0.01 | 0.00 – 0.01 | <0.001 |
| sex [male] | 2.48 | 0.80 – 4.16 | 0.004 | |||
| species [Chinstrap] | 5.54 | 4.00 – 7.09 | <0.001 | |||
| species [Gentoo] | 18.02 | 15.18 – 20.86 | <0.001 | |||
| Observations | 342 | 333 | ||||
| R2 / R2 adjusted | 0.759 / 0.758 | 0.856 / 0.855 | ||||
Some cool stuff with the sjplot package
Create a plot of predicted values based on the effect of body_mass_g
Function: plot_model() with type = "pred" specifically to plot predicted values
plot_model(Model2, type = "pred", terms = "body_mass_g")
Some cool stuff with the sjplot package
Function: plot_model() creates a ggplot object! So we can customize it!
plot_model(Model2, type = "pred", terms = "body_mass_g") + theme_minimal()
Some cool stuff with the sjplot package
Create a plot of the different parameter estimates in the model
Function: plot_model() without a type = pred argument
plot_model(Model2) + theme_minimal()
Other Statistical Modelling in R
Structural Equation Modelling: lavaan
Multilevel analyses: lme4
Cluster Analyses: mclust
Factor Analyses (or PCA) & reliability analyses (e.g., Cronbach's alpha): psych
Item Response Theory models: ltm or sirt or mirt
Bayesian analyses (using MCMC): brms