
ICO Workshop R & RStudio
Part 4
Powerful visualisations with ggplot2
2nd - 4th July, 2024
Overview
- Simple plots in R --- (click here)
- Grammar of graphics --- (click here)
- How
ggplot2works (in a nutshell) --- (click here) - Visualising a categorical variable --- (click here)
- Visualising a quantitative variable --- (click here)
- Visualising more than one variable --- (click here)
- More about visualisation? --- (click here)
1. Simple plots in R
Plots in base
The generic function plot() "knows" what to do (plot) with the input it receives.
# one quantitatieve variableplot(Friends$fluency)
# one qualitative variablesplot(table(Friends$condition))
boxplot( Friends$fluency, main = "Boxplot of the variable 'fluency'", col = "steelblue" )
hist( Friends$fluency, main = "Histogram of the variable 'fluency'", freq = FALSE, ylim = c(0, .08) )
2. Grammar of Graphics
A more theoretical approach to visualisation
Theoretical 'breakdown' of a visualisation into components (called layers)
One system to create different visualisations
At the heart of several modern graphical applications:
- ggplot2
- Tableau (Polaris)
- Vega-Lite
Slide taken from slide show by Thomas Lin Pedersen
Key idea behind the Grammar of Graphics
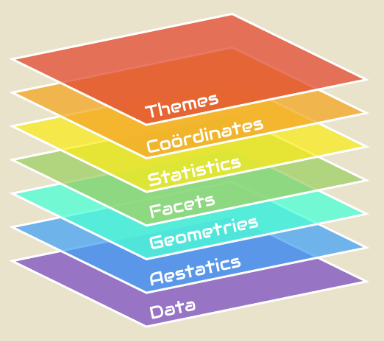
Layers of a visualisation:
data
aesthetics
geometries
facets
statistics
coordinates
themes
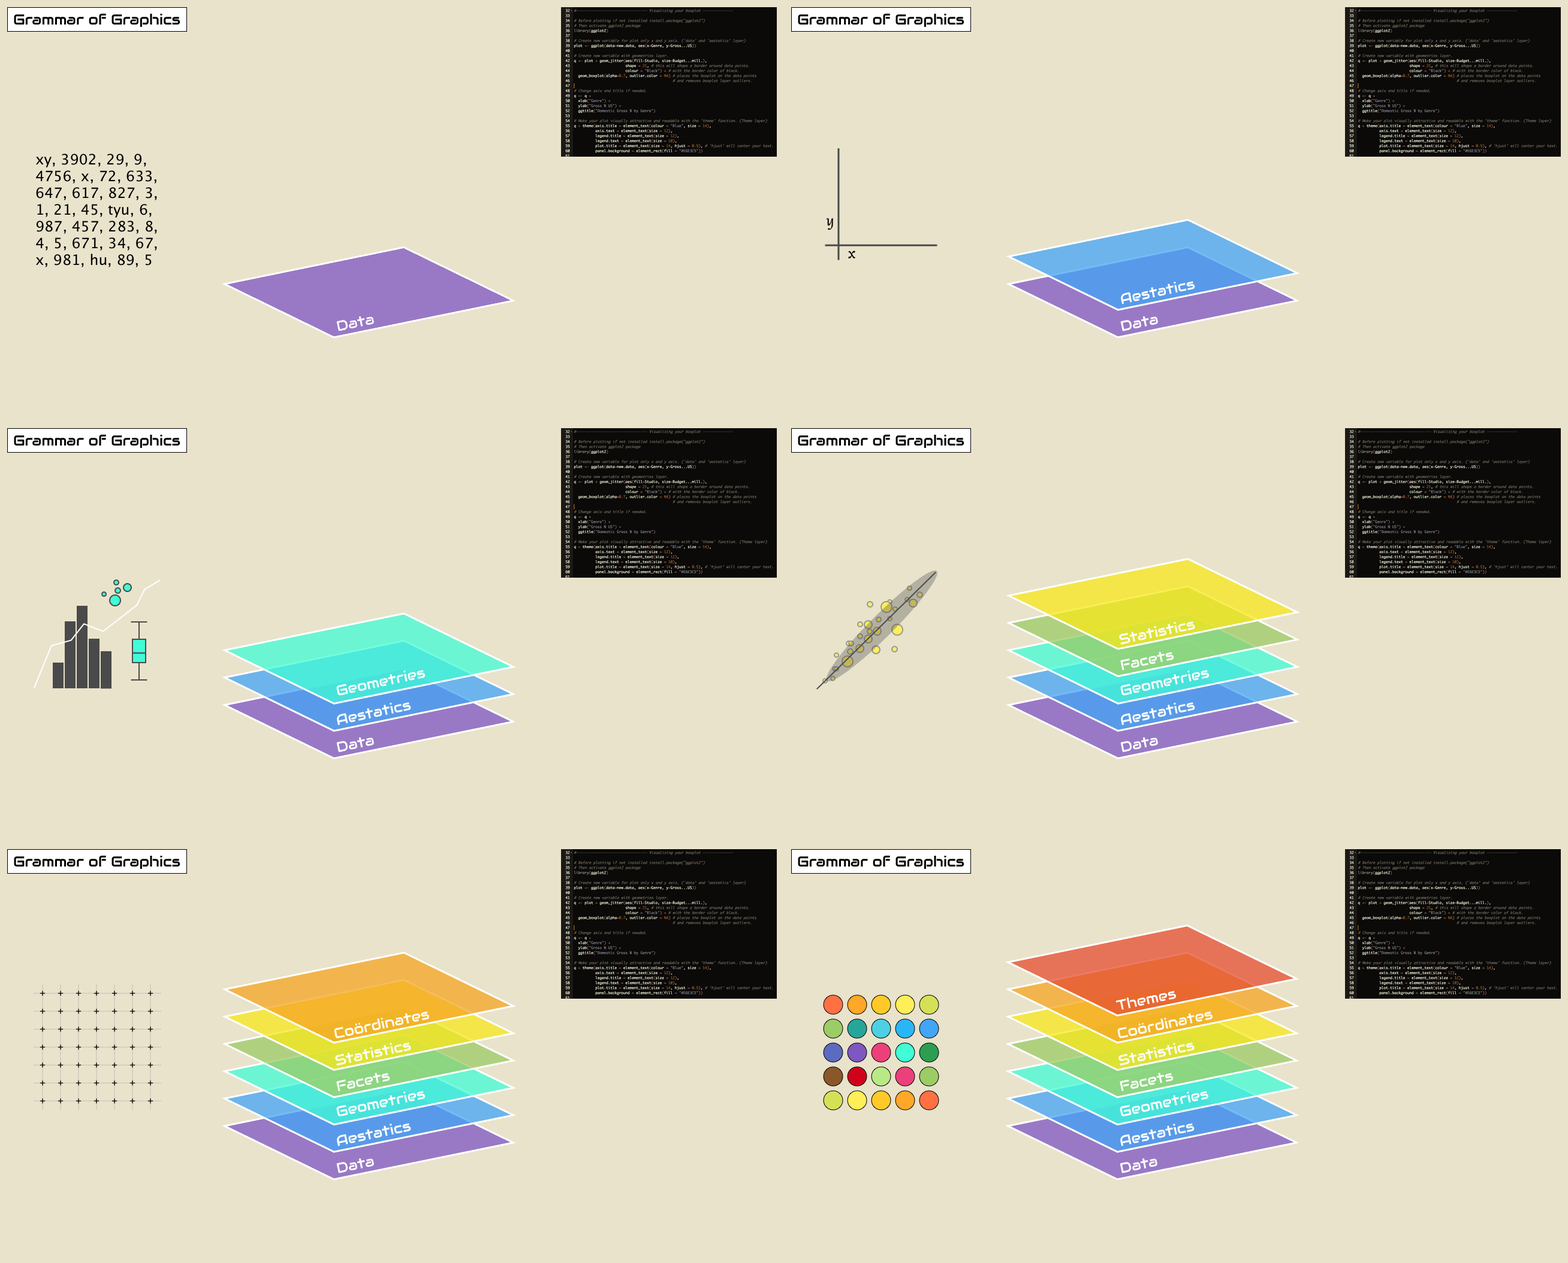
Animation by Thomas de Beus
Grammar of Graphics is a bit like cake
Start by setting up the foundation with ggplot()
Specify ingredients (variables) with aes() and a flavour with scales
Create layers to plot with geoms
Style the cake with theme
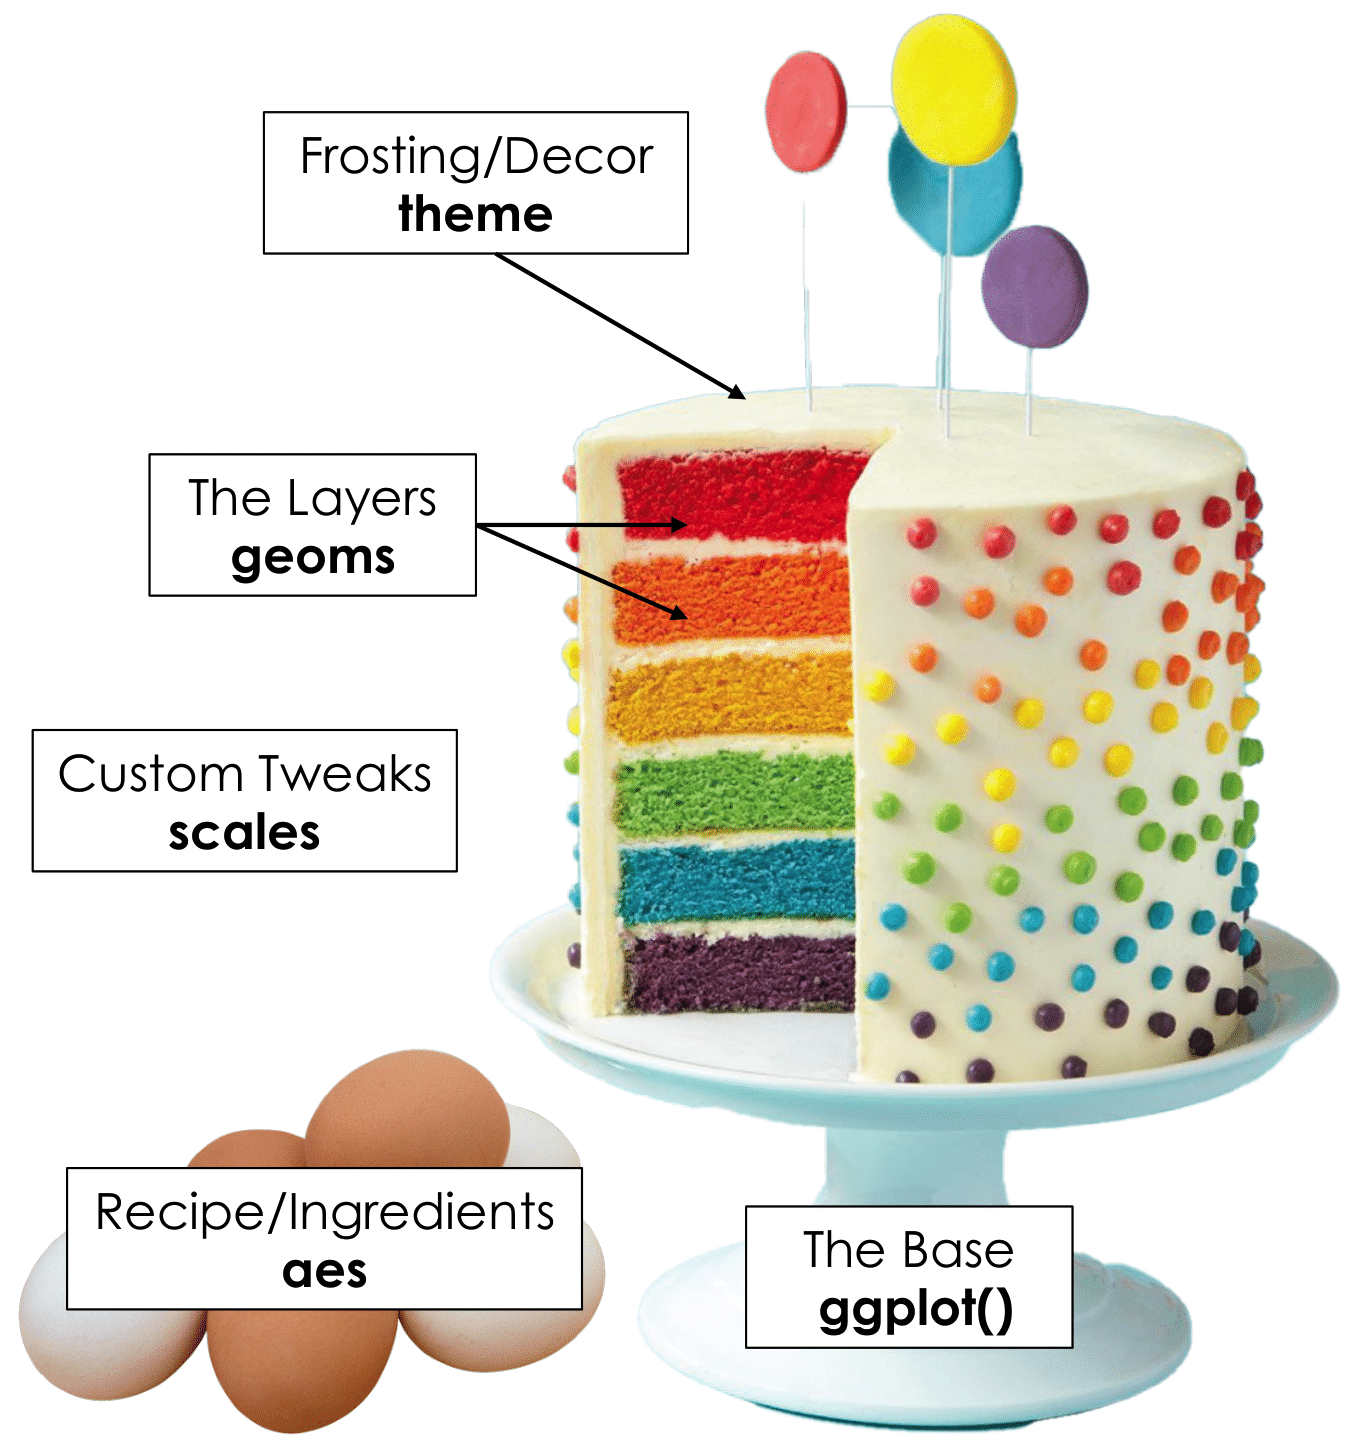
Slide by Tanya Shapiro
Grammar of Graphics: data
- Data is not only raw data, but can also be the results from an analysis
| group | country | gender | mean_age | SD_age | CI_lower | CI_upper |
|---|---|---|---|---|---|---|
| BE Male | BE | Male | 39 | 11.0 | 17.44 | 60.56 |
| BE Female | BE | Female | 41 | 13.2 | 15.13 | 66.87 |
| BE Other | BE | Other | 36 | 8.2 | 19.93 | 52.07 |
| NL Male | NL | Male | 37 | 12.0 | 13.48 | 60.52 |
| NL Female | NL | Female | 36 | 14.0 | 8.56 | 63.44 |
| NL Other | NL | Other | 31 | 7.2 | 16.89 | 45.11 |
- Data has to be 'tidy'

Grammar of Graphics: aesthetics
Describe how variables in data are mapped to visual properties. For example:
- variables mapped on x- and y-axis
- variable that defines color or size of points
- ...
Change appearances of aesthetics using
scales


Grammar of Graphics: geometries
- Geometrical shapes at the heart of visualisation. For example:
- boxplot
- line
- ...


Grammar of Graphics: facets
Also called 'small multiples'
Define how much panels are shown and how they are arranged


Grammar of Graphics: statistics
Data might be
tidy, but still in need of some statistical calculations. For example:- Calculate descriptive statistics to create a boxplot
- Estimate a linear (or other) model to draw a regression line in a scatter plot
Often implicit done by
ggplot2

3. How ggplot2 works (in a nutshell)

Time to get the penguins in...
Nice data set that can be used within R (Source: https://allisonhorst.github.io/palmerpenguins/articles/intro.html)
install.packages("palmerpenguins")library(palmerpenguins)data("penguins")
Artwork by @allison_horst

Time to get the penguins in...
Table: Table 1. Random sample of 10 observations from the Palmer Pinguins dataset
| species | island | bill_length_mm | bill_depth_mm | flipper_length_mm | body_mass_g | sex | year |
|---|---|---|---|---|---|---|---|
| Adelie | Dream | 39.6 | 18.8 | 190 | 4600 | male | 2007 |
| Gentoo | Biscoe | 51.1 | 16.5 | 225 | 5250 | male | 2009 |
| Gentoo | Biscoe | 45.2 | 15.8 | 215 | 5300 | male | 2008 |
| Gentoo | Biscoe | 47.5 | 15.0 | 218 | 4950 | female | 2009 |
| Adelie | Dream | 36.0 | 17.1 | 187 | 3700 | female | 2009 |
| Adelie | Dream | 36.0 | 17.8 | 195 | 3450 | female | 2009 |
| Gentoo | Biscoe | 43.8 | 13.9 | 208 | 4300 | female | 2008 |
| Adelie | Biscoe | 39.6 | 20.7 | 191 | 3900 | female | 2009 |
| Adelie | Torgersen | 46.0 | 21.5 | 194 | 4200 | male | 2007 |
| Adelie | Dream | 36.8 | 18.5 | 193 | 3500 | female | 2009 |
The basics of ggplot2: data & aesthetics
Plot <- ggplot( ## Step 1: data data = penguins, ## Step 2: specify aesthetics (mapping) aes( x = flipper_length_mm, y = body_mass_g))Plot
The basics of ggplot2: geometry
Plot <- ggplot( ## Step 1: data data = penguins, ## Step 2: specify aesthetics (mapping) aes( x = flipper_length_mm, y = body_mass_g)) + ## Step 3: add geometry geom_point()Plot
Not every component of the Grammar of Graphics needs to be defined. The other components have default values that are automatically applied.
The basics of ggplot2: facets
Plot <- ggplot( ## Step 1: data data = penguins, ## Step 2: specify aesthetics (mapping) aes( x = flipper_length_mm, y = body_mass_g)) + ## Step 3: add geometry geom_point() + ## Step 4: define facets facet_wrap(~species)Plot
The basics of ggplot2: theme
Plot <- ggplot( ## Step 1: data data = penguins, ## Step 2: specify aesthetics (mapping) aes( x = flipper_length_mm, y = body_mass_g)) + ## Step 3: add geometry geom_point() + ## Step 4: define facets facet_wrap(~species) + ## Step 5: set theme theme_minimal()Plot
Building a visualisation by adding layers ...

Several geom_* options...
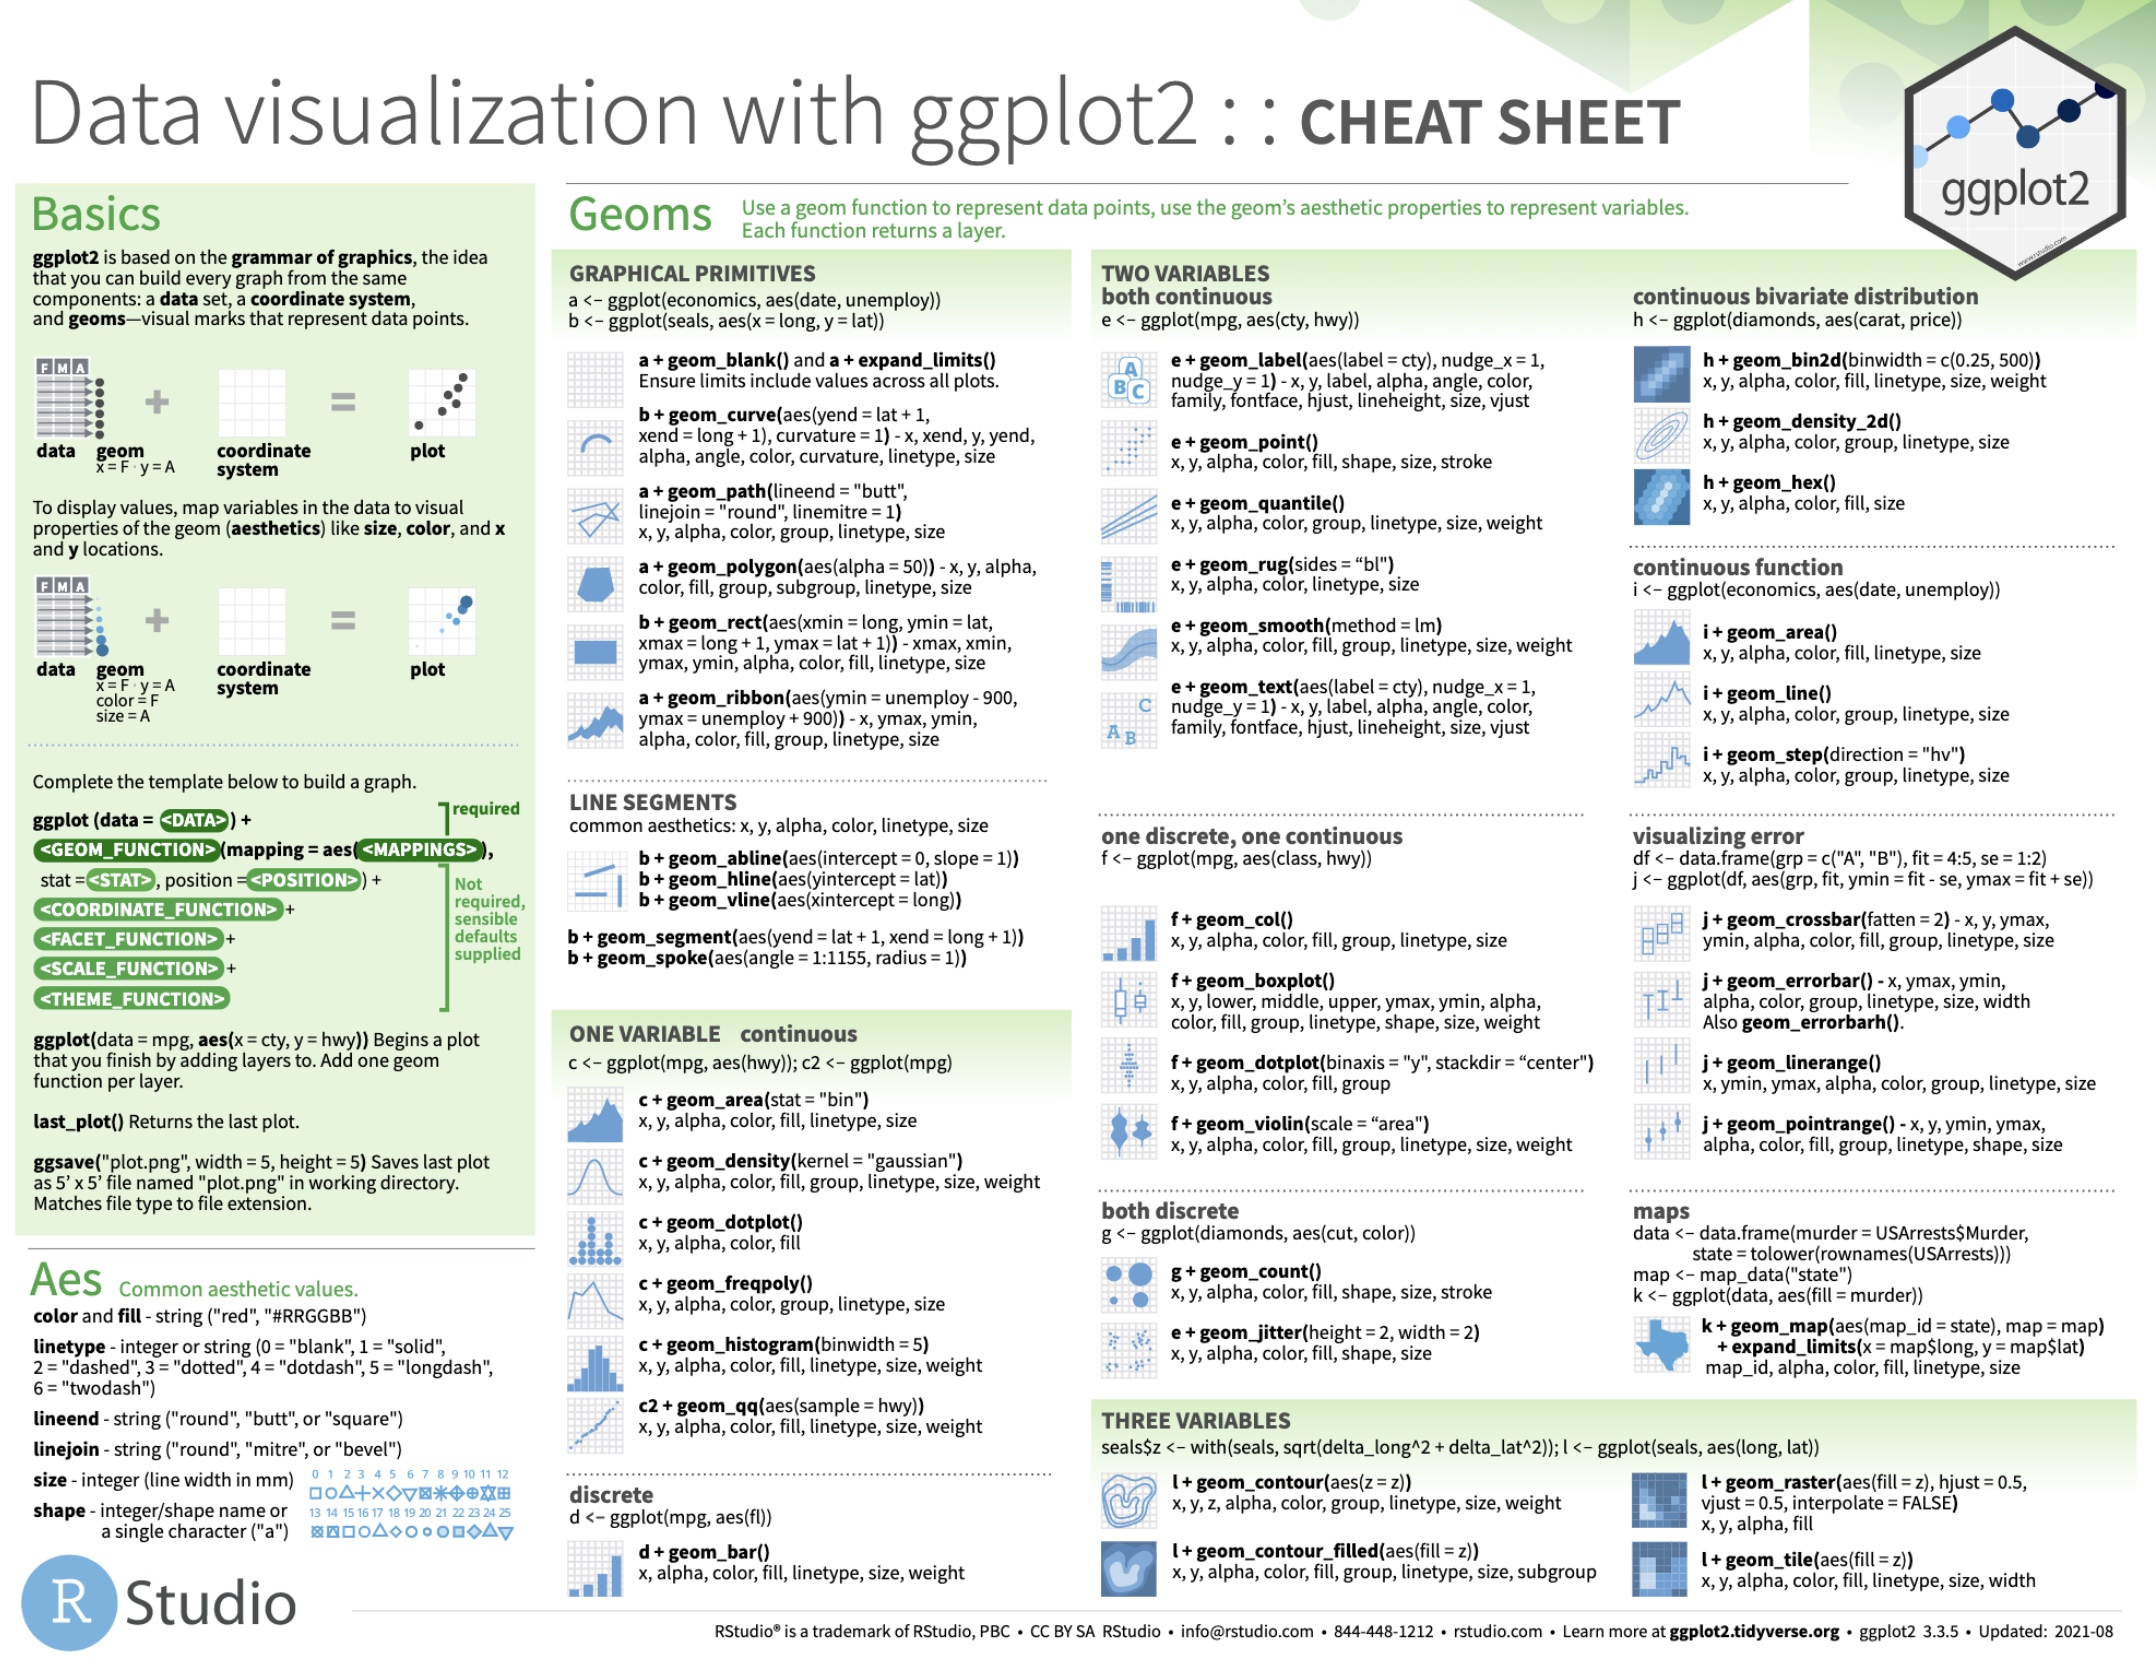
4. Visualising a categorical variable
"The bar is open... Let's have a lollipop?"
Visualising a categorical variable?
There are many ways to visualise a categorical variable...
Can you think of some?
Visualising a categorical variable?
There are many ways to visualise a categorical variable...
Can you think of some?
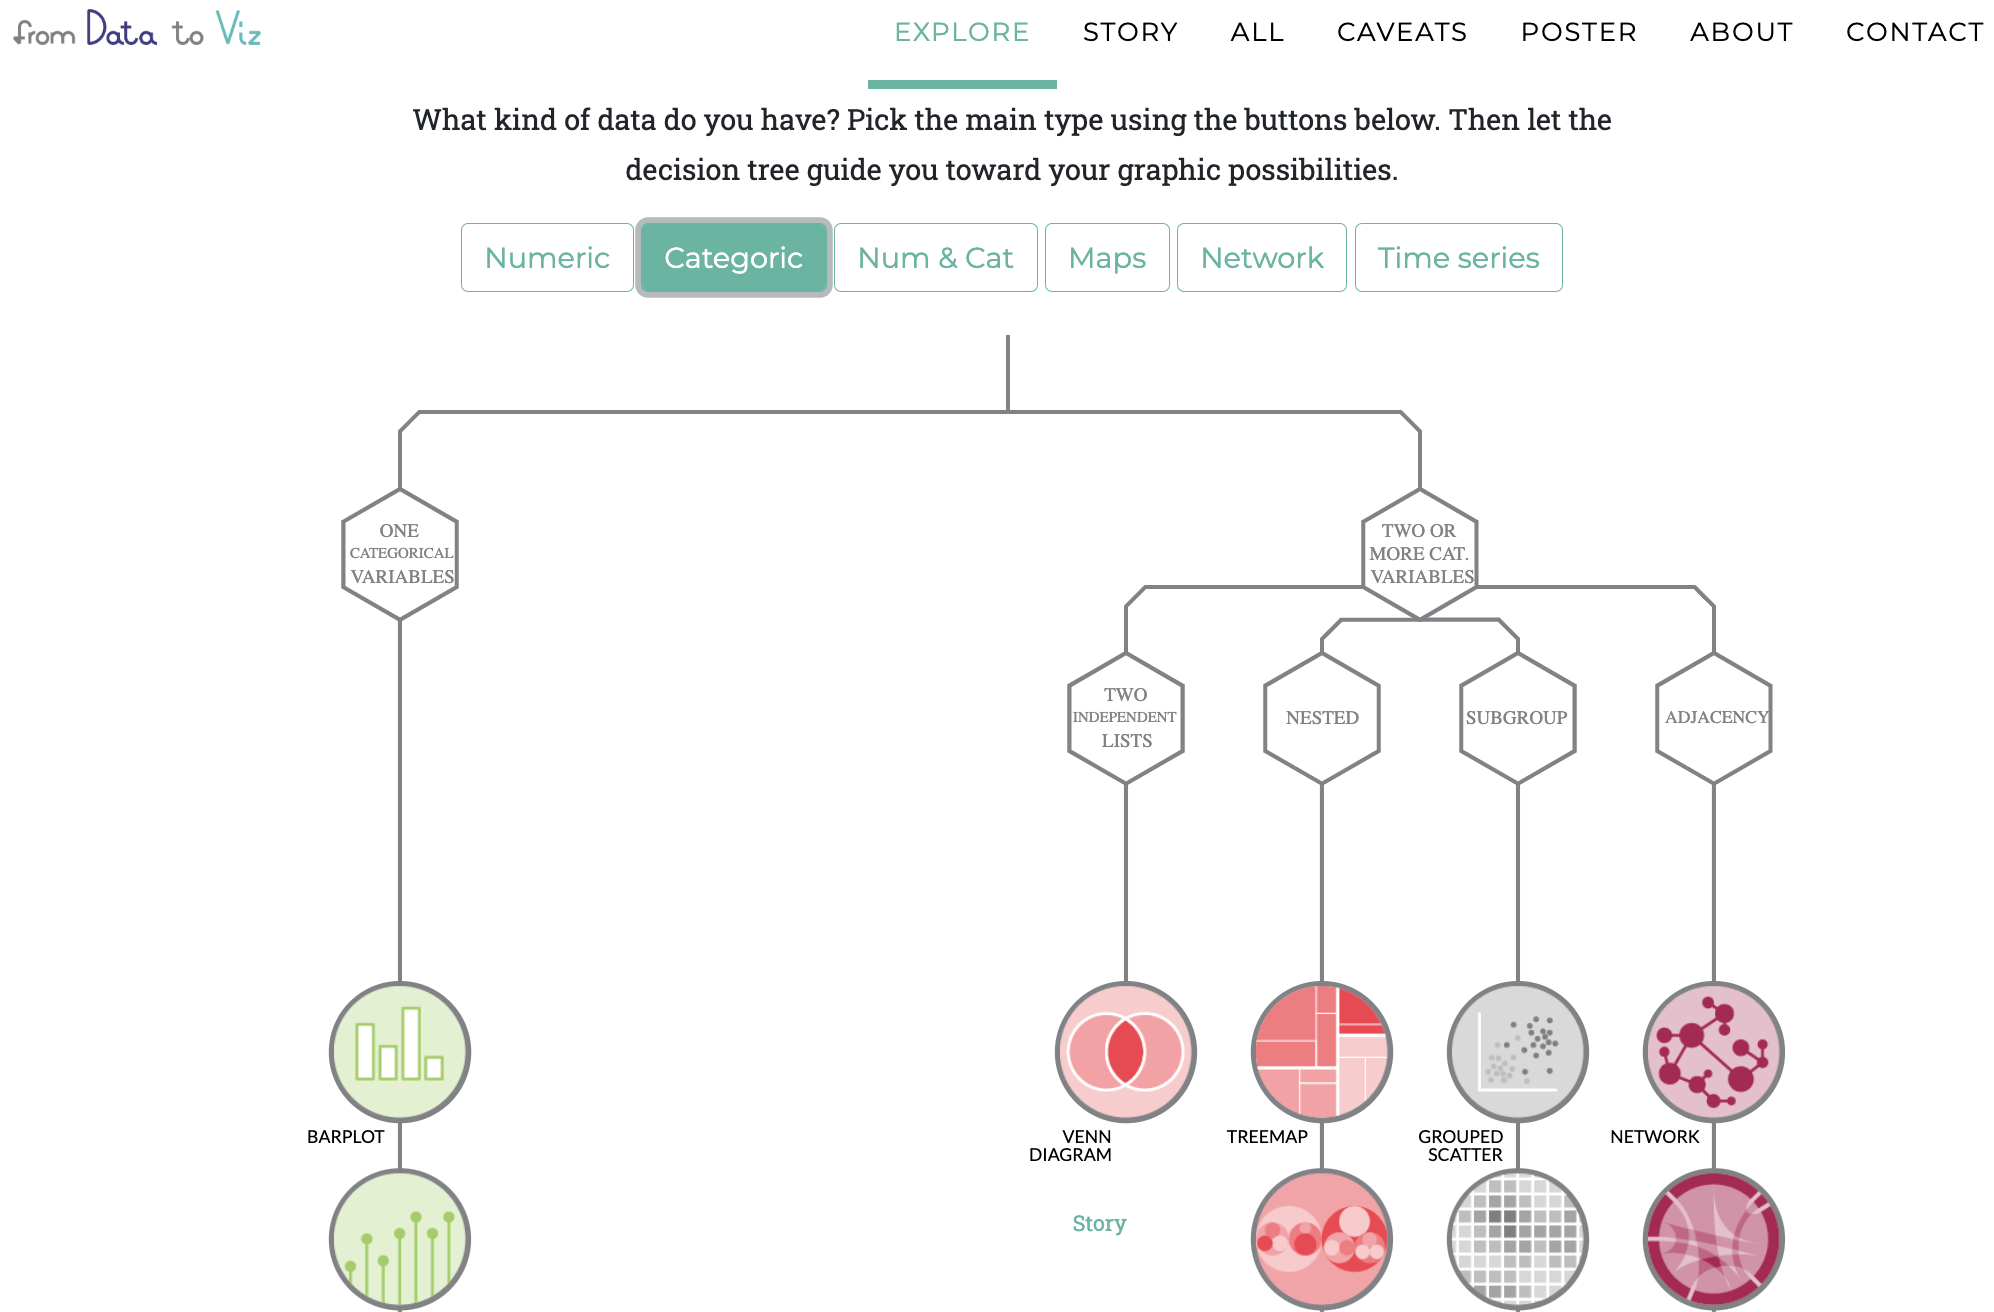
Have a look at data to viz.com
Creating a barplot with geom_bar() or geom_col()
geom_bar()

geom_col()

Creating a barplot with geom_bar() or geom_col()
geom_bar()

geom_col()

ggplot( penguins, aes( x = species ) ) + geom_bar()# stat_count() does the counting automaticallycount_data <- penguins %>% count(species, name = 'count')ggplot( count_data, aes( x = species, y = count ) ) + geom_col()Creating a barplot with geom_bar()
- Add color to barplot by defining an additional aesthetic:
fill
ggplot( penguins, aes( x = species ) ) + geom_bar( ## Additional aesthetic: "fill"-scale aes(fill = species) )
Creating a barplot with geom_bar()
- Determine
fill-colors by addingscale_fill_manual()
ggplot( penguins, aes( x = species ) ) + geom_bar( aes(fill = species) ) + ## Specify fill-colors scale_fill_manual( values = c("darkorange", "purple", "cyan4") )
Creating a barplot with geom_bar()
- Add title, subtitle and change label of x-axis using
labs()
ggplot( penguins, aes( x = species ) ) + geom_bar( aes(fill = species) ) + scale_fill_manual( values = c("darkorange","purple","cyan4") ) + ## Add title, subtitle and label x-axis labs( title = "Palmer penguins", subtitle = "n observations for species", x = "" )
Creating a barplot with geom_bar()
- Add another theme using
theme_minimal()
ggplot( penguins, aes( x = species ) ) + geom_bar( aes(fill = species) ) + scale_fill_manual( values = c("darkorange","purple","cyan4") ) + labs( title = "Palmer penguins", subtitle = "n observations for species", x = "" ) + ## Choose theme theme_minimal()
Creating a barplot with geom_bar()
- Flip x- and y-axis using
coord_flip() - Remove legend using
theme(legend.position = "none")
ggplot( penguins, aes( x = species ) ) + geom_bar( aes(fill = species) ) + scale_fill_manual( values = c("darkorange","purple","cyan4") ) + labs( title = "Palmer penguins", subtitle = "n observations for species", x = "" ) + ## Flip x- and y-axis coord_flip( ) + theme_minimal( ) + ## Remove legend theme( legend.position = "none" )
Creating a lollipop plot
Use two geoms: geom_point() and geom_segment()
penguins %>% count(species) %>% ggplot( aes( x = species, y = n) ) + geom_point( aes(col = species) ) + geom_segment( aes( x = species, xend = species, y = 0, yend = n, col = species ) ) +Re-use remainder of code!
scale_colour_manual( values = c("darkorange","purple","cyan4") ) + labs( title = "Palmer penguins", subtitle = "n observations for species", x = "" ) + coord_flip( ) + theme_minimal( ) + theme( legend.position = "none" )
Creating a lollipop plot
- Reorder 'bars' by creating a new variable using
fct_reorder()
penguins %>% count(species) %>% ## Create an ordered factor mutate( species_ord = fct_reorder(species,n) ) %>% ggplot( aes(x = species_ord, y = n)) + geom_point( aes(col = species) ) + geom_segment( aes( x = species, xend = species, y = 0, yend = n, col = species ) ) + scale_colour_manual( values = c("darkorange","purple","cyan4") ) + labs( title = "Palmer penguins", subtitle = "n observations for species", x = "" ) + coord_flip( ) + theme_minimal( ) + theme( legend.position = "none" )
Exercises [ggplot2] : part 1

You can find the qmd-file
Exercises_ggplot2.qmdat the course website.Download the qmd-file
Exercises_ggplot2.qmdto your laptopOpen the file in
RStudioThe file contains a set of coding assignments with empty code blocks
Now, we focus on part 1 of the exercises
Write the code (and test it by running it)
Stuck? No Worries!
- We are there
- Help each other
- There is a solution key (at the website) (
Exercises_ggplot2_solutions.qmd)
5. Visualising a quantitative variable
Visualising a quantitative variable?
There are many ways to visualise a quantitative variable...
Can you think of some?
Visualising a quantitative variable?
There are many ways to visualise a quantitative variable...
Can you think of some?
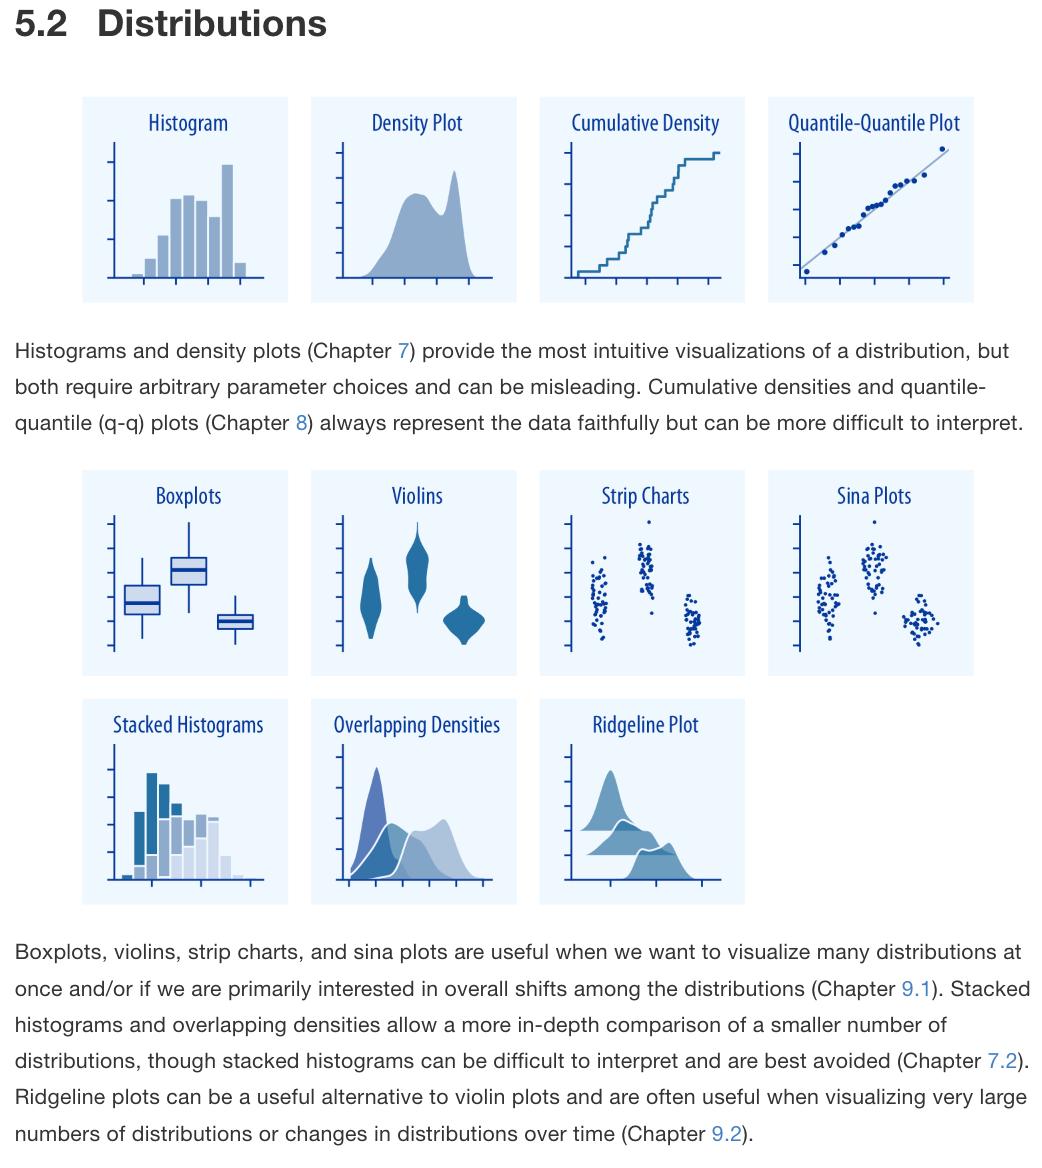
Taken from Fundamentals of Data Visualization by Claus Wilke
Creating a histogram with geom_histogram()
ggplot( penguins, aes( x = flipper_length_mm ) ) + geom_histogram()
Creating a histogram with geom_histogram()
- Change breaks on y-axis using
scale_y_continuous()
ggplot( penguins, aes( x = flipper_length_mm ) ) + geom_histogram() + ## Specify breaks scale_y_continuous( breaks = c(seq(0, 25, 5), 29) )
Creating a histogram with geom_histogram()
- Change transparency using argument
alpha - Remove minor grid lines using argument
panel.grid.minor = element_blank()
ggplot( penguins, aes( x = flipper_length_mm, fill = species ) ) + geom_histogram( ## Change transparency of points alpha = .7 ) + ## Specify breaks scale_y_continuous( breaks = c(seq(0, 25, 5), 29) ) + scale_fill_manual( values = c("darkorange","purple","cyan4") ) + labs( title = "Palmer penguins", subtitle = "Histogram of flipper length", x = "Flipper length" ) + theme_minimal() + theme( ## Remove minor grid lines panel.grid.minor = element_blank() )
Creating a density plot° with geom_density()
- Replace
geom_histogram()withgeom_density()plot
ggplot( penguins, aes( x = flipper_length_mm, fill = species ) ) + ## Use geom_density geom_density( alpha = .7 ) + scale_fill_manual( values = c("darkorange","purple","cyan4") ) + labs( title = "Palmer penguins", subtitle = "Density plot of flipper length", x = "Flipper length" ) + theme_minimal()°surface below curve = 100%

Creating a density plot with geom_density()
- Only colored lines by replacing argument
fillwithcolor
ggplot( penguins, aes( x = flipper_length_mm, color = species ) ) + geom_density() + ## Replace scale_color with scale_fill scale_color_manual( values = c("darkorange","purple","cyan4") ) + labs( title = "Palmer penguins", subtitle = "Density plot of flipper length", x = "Flipper length" ) + theme_minimal() + theme( panel.grid.minor = element_blank() )
Or even better ... geom_violin() + geom_jitter()
ggplot( penguins, aes( x = species, y = flipper_length_mm, ## Aesthetics fill and color applied to EVERY geom fill = species, color = species ) ) + ## Use geom_violin and geom_jitter geom_violin( alpha = .65 ) + geom_jitter( alpha = .7 ) + scale_fill_manual( values = c("darkorange","purple","cyan4") ) + scale_color_manual( values = c("darkorange","purple","cyan4") ) + labs( title = "Palmer penguins", subtitle = "Density plot voor flipper lengte", y = "Flipper length", x = "", ) + theme_minimal() + theme( legend.position = "none" )
Or even better geom_violin() + geom_jitter()
- Put names of species on top using argument
position="top" - Remove minor grid lines using argument
panel.grid.major = element_blank()
ggplot( penguins, aes( x = species, y = flipper_length_mm, fill = species, color = species ) ) + geom_violin( alpha = .65 ) + geom_jitter( alpha = .7 ) + scale_x_discrete( position = "top" ) + scale_fill_manual( values = c("darkorange","purple","cyan4") ) + scale_color_manual( values = c("darkorange","purple","cyan4") ) + labs( title = "Palmer penguins", subtitle = "Density plot of flipper length", y = "Flipper length", x = "", ) + theme_minimal() + theme( legend.position = "none", panel.grid.minor = element_blank(), ## Remove major grid lines panel.grid.major.x = element_blank() )
Or a rain cloud plot (Appendix 1: How to grow a rain cloud plot?)
Additional package required: ggdist
library(ggdist)ggplot(penguins, aes(x = species, y = flipper_length_mm)) + stat_halfeye( adjust = .5, width = .6, .width = 0, justification = -.2, point_colour = NA ) + geom_boxplot( width = .15, outlier.shape = NA ) + geom_point( size = 1.3, alpha = .3, position = position_jitter( seed = 1, width = .1 )) + labs( title = "Palmer penguins", subtitle = "Distribution of flipper length by species", x = "", y = "Flipper length" ) + coord_cartesian(xlim = c(1.2, NA), clip = "off") + coord_flip() + theme_minimal() Exercises [ggplot2] : part 2

You can find the qmd-file
Exercises_ggplot2.qmdat the course website.Download this file to your laptop
Open the file in
RStudioThe file contains a set of coding assignments with empty code blocks
Now, we focus on part 2 of the exercises
Write the code (and test it by running it)
Stuck? No Worries!
- We are there
- Help each other
- There is a solution key (
Exercises_ggplot2_solutions.qmd)
6. Visualising more than one variable
Visualising more than one variable?
There are many ways to visualise more than one variable... The choice depends (among other things) on the type of variables you want to plot:
- only quantitative variables;
- only qualitative variables;
- or a combination of both
Can you think of an example of each?
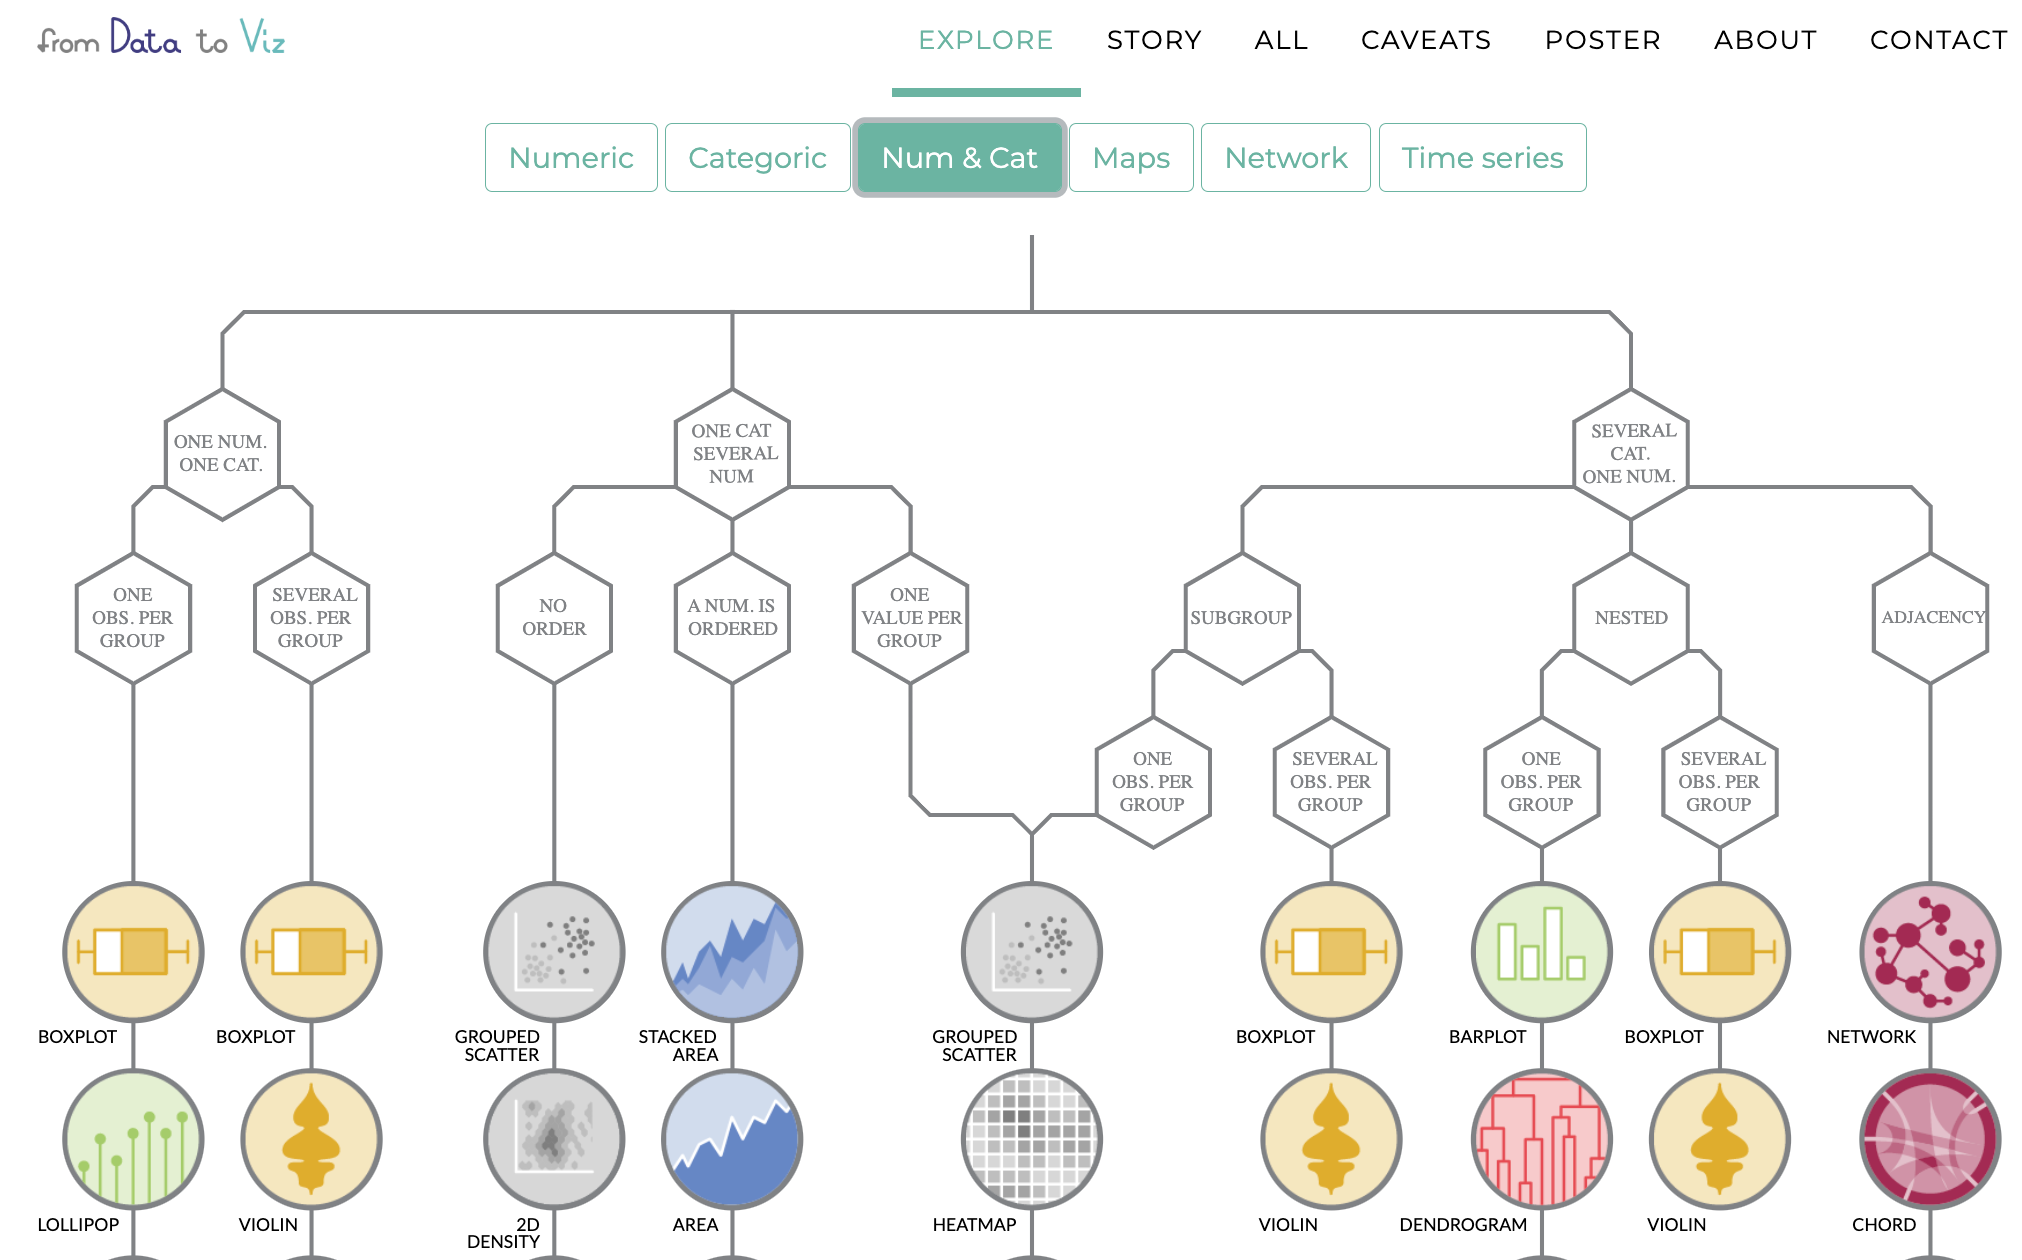
Have a look at data to viz.com
Visualising more than one variable
We focus today upon:
- scatterplots (two numeric variables, two numeric variables and one categorical variable)
- grouped barplots (two categorical variables)
Creating a scatterplot with geom_point()
ggplot( penguins, aes( x = body_mass_g, y = flipper_length_mm ) ) + geom_point() + labs( title = "Palmer penguins", subtitle = "Relation of flipper length with body mass", y = "Flipper length", x = "Body mass", ) + theme_minimal() + theme( legend.position = "none" )
Creating a scatterplot with geom_point() and geom_smooth()
- Add trend line using
geom_smooth()
ggplot( penguins, aes( x = body_mass_g, y = flipper_length_mm ) ) + geom_point() + ## Add a trendline geom_smooth() + labs( title = "Palmer penguins", subtitle = "Relation of flipper length with body mass", y = "Flipper length", x = "Body mass" ) + theme_minimal() + theme( legend.position = "none" )
Creating a scatterplot with geom_point() and geom_smooth()
- Linear trend line using argument
method = "lm" - Remove confidence intervals using argument
se = FALSE
ggplot( penguins, aes( x = body_mass_g, y = flipper_length_mm ) ) + geom_point() + geom_smooth( ## Add linear trend line method = "lm", ## Remove confidence band se = FALSE ) + labs( title = "Palmer penguins", subtitle = "Correlation between flipper length and body mass", y = "Flipper length", x = "Body mass", ) + theme_minimal() + theme( legend.position = "none" )
Creating a scatterplot with geom_point() and geom_smooth()
- Add shape and color by specifying aesthetics:
shapeandcolor - Change legend position and background, position of plot title, and layout of (sub)title
ggplot( penguins, aes( x = flipper_length_mm, y = body_mass_g ) ) + geom_point( aes( color = species, shape = species ), size = 3, alpha = 0.8 ) + geom_smooth( aes(color = species), se = F, method = "lm" ) + theme_minimal() + scale_color_manual( values = c("darkorange","purple","cyan4")) + labs( title = "Palmer penguins", subtitle = "Correlation between flipper length and body mass", y = "Flipper length", x = "Body mass", color = "Species", shape = "Species") + theme( legend.position = c(0.2, 0.7), legend.background = element_rect(fill = "white", color = NA), plot.title.position = "plot", plot.title = element_text(hjust = 0, face= "bold"), plot.subtitle = element_text(hjust = 0, face= "italic") )
Creating a scatterplot with geom_point() and geom_smooth()
- Adds facets using
facet_wrap()
ggplot( penguins, aes( x = body_mass_g, y = flipper_length_mm ) ) + geom_point( ) + geom_smooth( method = "lm", se = FALSE ) + facet_wrap(~species) + labs( title = "Palmer penguins", subtitle = "Correlation between flipper length and body mass", y = "Flipper length", x = "Body mass", ) + theme_minimal() + theme( legend.position = "none", plot.title = element_text(hjust = 0, face= "bold"), plot.subtitle = element_text(hjust = 0, face= "italic") )
Creating a barplot of two variables (counts)
Grouped barplot of counts usingposition_dodge()

Stacked barplot of counts using argumentposition_stack()

Creating a barplot of two variables (counts)
Grouped barplot of counts usingposition_dodge()

Stacked barplot of counts using argumentposition_stack()

penguins %>% ggplot( aes( x = island, fill = species ) ) + geom_bar( position = position_dodge() ) + theme_minimal()penguins %>% ggplot( aes( x = island, fill = species) ) + geom_bar( position = position_stack() ) + theme_minimal()Creating a barplot of two variables (percentage)
- Switch to relative frequencies using
position_fill()
penguins %>% ggplot( aes( x = island, fill = species ) ) + geom_bar( position = position_fill() ) + theme_minimal()
Creating a barplot of two variables (percentage)
- Add texts to bars using
geom_text() - Add "fill" colors using
scale_fill_brewer() - Remove additional space using
coord_cartesian(expand=FALSE)
penguins %>% ggplot( aes( x = island, fill = species ) ) + geom_bar( position = position_fill(), alpha = .9 ) + geom_text( aes(label = ..count..), stat = "count", colour = "white", position = position_fill(vjust = 0.5) ) + scale_fill_brewer( type = "qual", palette = 6 ) + scale_x_discrete(position = "top")+ scale_y_continuous(breaks = c(0.5, 1)) + labs( title = "Palmer penguins", subtitle = "Distribution of penguin species by island", fill = "Species" ) + coord_cartesian(expand = FALSE) + theme_minimal() + theme( plot.title = element_text(size = 20, face = "bold"), plot.subtitle = element_text(size = 16, face = "italic"), axis.title = element_blank(), axis.text.x = element_text(size = 14, face = "bold"), legend.title = element_text(face = "bold"), panel.grid.minor = element_blank(), panel.grid.major.x = element_blank() )
Chosing colors ...
Colors are not meaningless and ... they grab attention
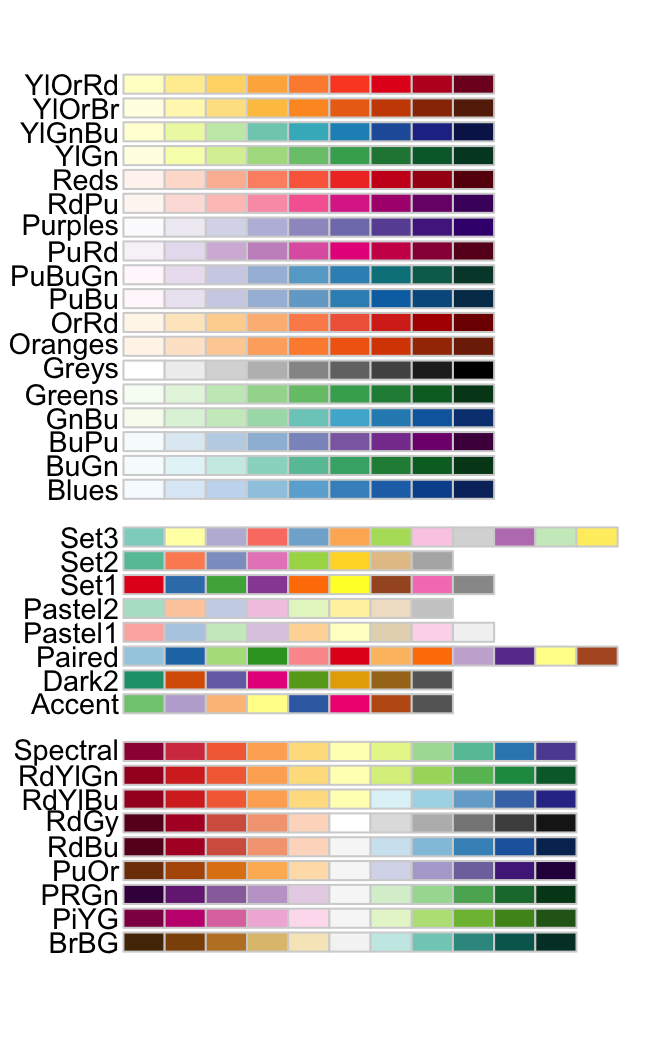
R has several built-in color palettes. The functions
scale_fill_brewerandscale_color_breweruse palettes of RColorBrewer. These palettes come in three 'flavours':- sequential: for ordered data ((for example, scoring low/mediocre/high on a likert scale)
- qualitative: for nominal or categorical information (for example, different islands)
- diverging: for ordered data with meaningful mid values ((for example, temperature or change in score)
Exercises [ggplot2] : part 3

You can find the qmd-file
Exercises_ggplot2.qmdat the course website.Download this file to your laptop
Open the file in
RStudioThe file contains a set of coding assignments with empty code blocks
Now, we focus on part 3 of the exercises
Write the code (and test it by running it)
Stuck? No Worries!
- We are there
- Help each other
- There is a solution key (
Exercises_ggplot2_solutions.qmd)
7. More about visualisation?
Which visualisation to use?
In need of help?
Don't forget RStudio's help-function!

Google is your best fRiend...
Just google your question and you'll find code, examples, ...
Generative AI can help as well!
Step 1
library(ggdist)P1 <- ggplot( penguins, aes( x = species, y = flipper_length_mm ) ) + stat_halfeye() P1
Step 2
P1 <- ggplot( penguins, aes( x = species, y = flipper_length_mm ) ) + stat_halfeye( adjust = .5, width = .6, .width = 0, justification = -.2, point_colour = NA ) P1
Step 3
P2 <- P1 + geom_boxplot( width = .15, outlier.shape = NA ) P2
Step 4
P3 <- P2 + geom_point( size = 1.3, alpha = .3, position = position_jitter( seed = 1, width = .1 ) ) P3
Step 5
P4 <- P3 + labs( title = "Palmer penguins", subtitle = "Distribution of flipper length by species", x = "", y = "Flipper length" ) P4
Step 6
P5 <- P4 + coord_cartesian(xlim = c(1.2, NA), clip = "off") + coord_flip() + theme_minimal() + theme( plot.title.position = "plot", plot.title = element_text(face = "bold"), plot.subtitle = element_text(face = "italic") )P5
