
ICO Workshop R & RStudio
Part 3
Data manipulation with dplyr
2nd - 4th July, 2024
Overview
- Tidyverse --- (Click here)
- The
dplyrpackage --- (Cliick here) - Implementation --- (Click here)
1. Tidyverse
Welcom in the tidyverse
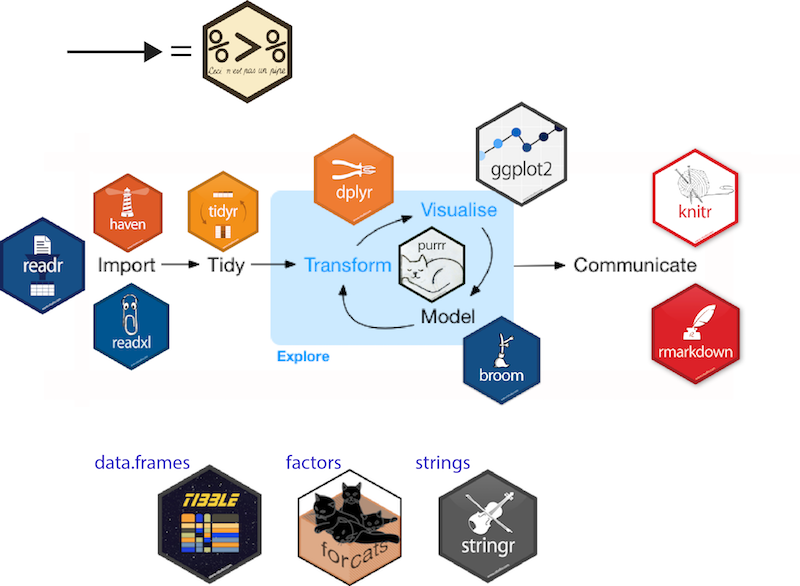
Why tidyverse?
more accessible for beginners
consistent approach for all potential tasks
powerful potential applications mith minimum 'effort'
can give confidence to explore
R
Tibble
Normally we work with a dataframe in R but we can have very complex data-structures as well (e.g., lists, matrices, ...)
In the tidyverse ecosystem we work with a simple form of data-structure: a tibble
A tibble is a dataframe that fits the tidy data principle
Friends## # A tibble: 108 × 4## student occassion condition fluency## <dbl> <dbl> <dbl> <dbl>## 1 1 1 1 101. ## 2 1 2 1 104. ## 3 1 3 1 117. ## 4 2 1 2 98.8## 5 2 2 2 107. ## 6 2 3 2 111. ## 7 3 1 3 105. ## 8 3 2 3 102. ## 9 3 3 3 101. ## 10 4 1 1 102. ## # ℹ 98 more rowsWhat is tidy data?
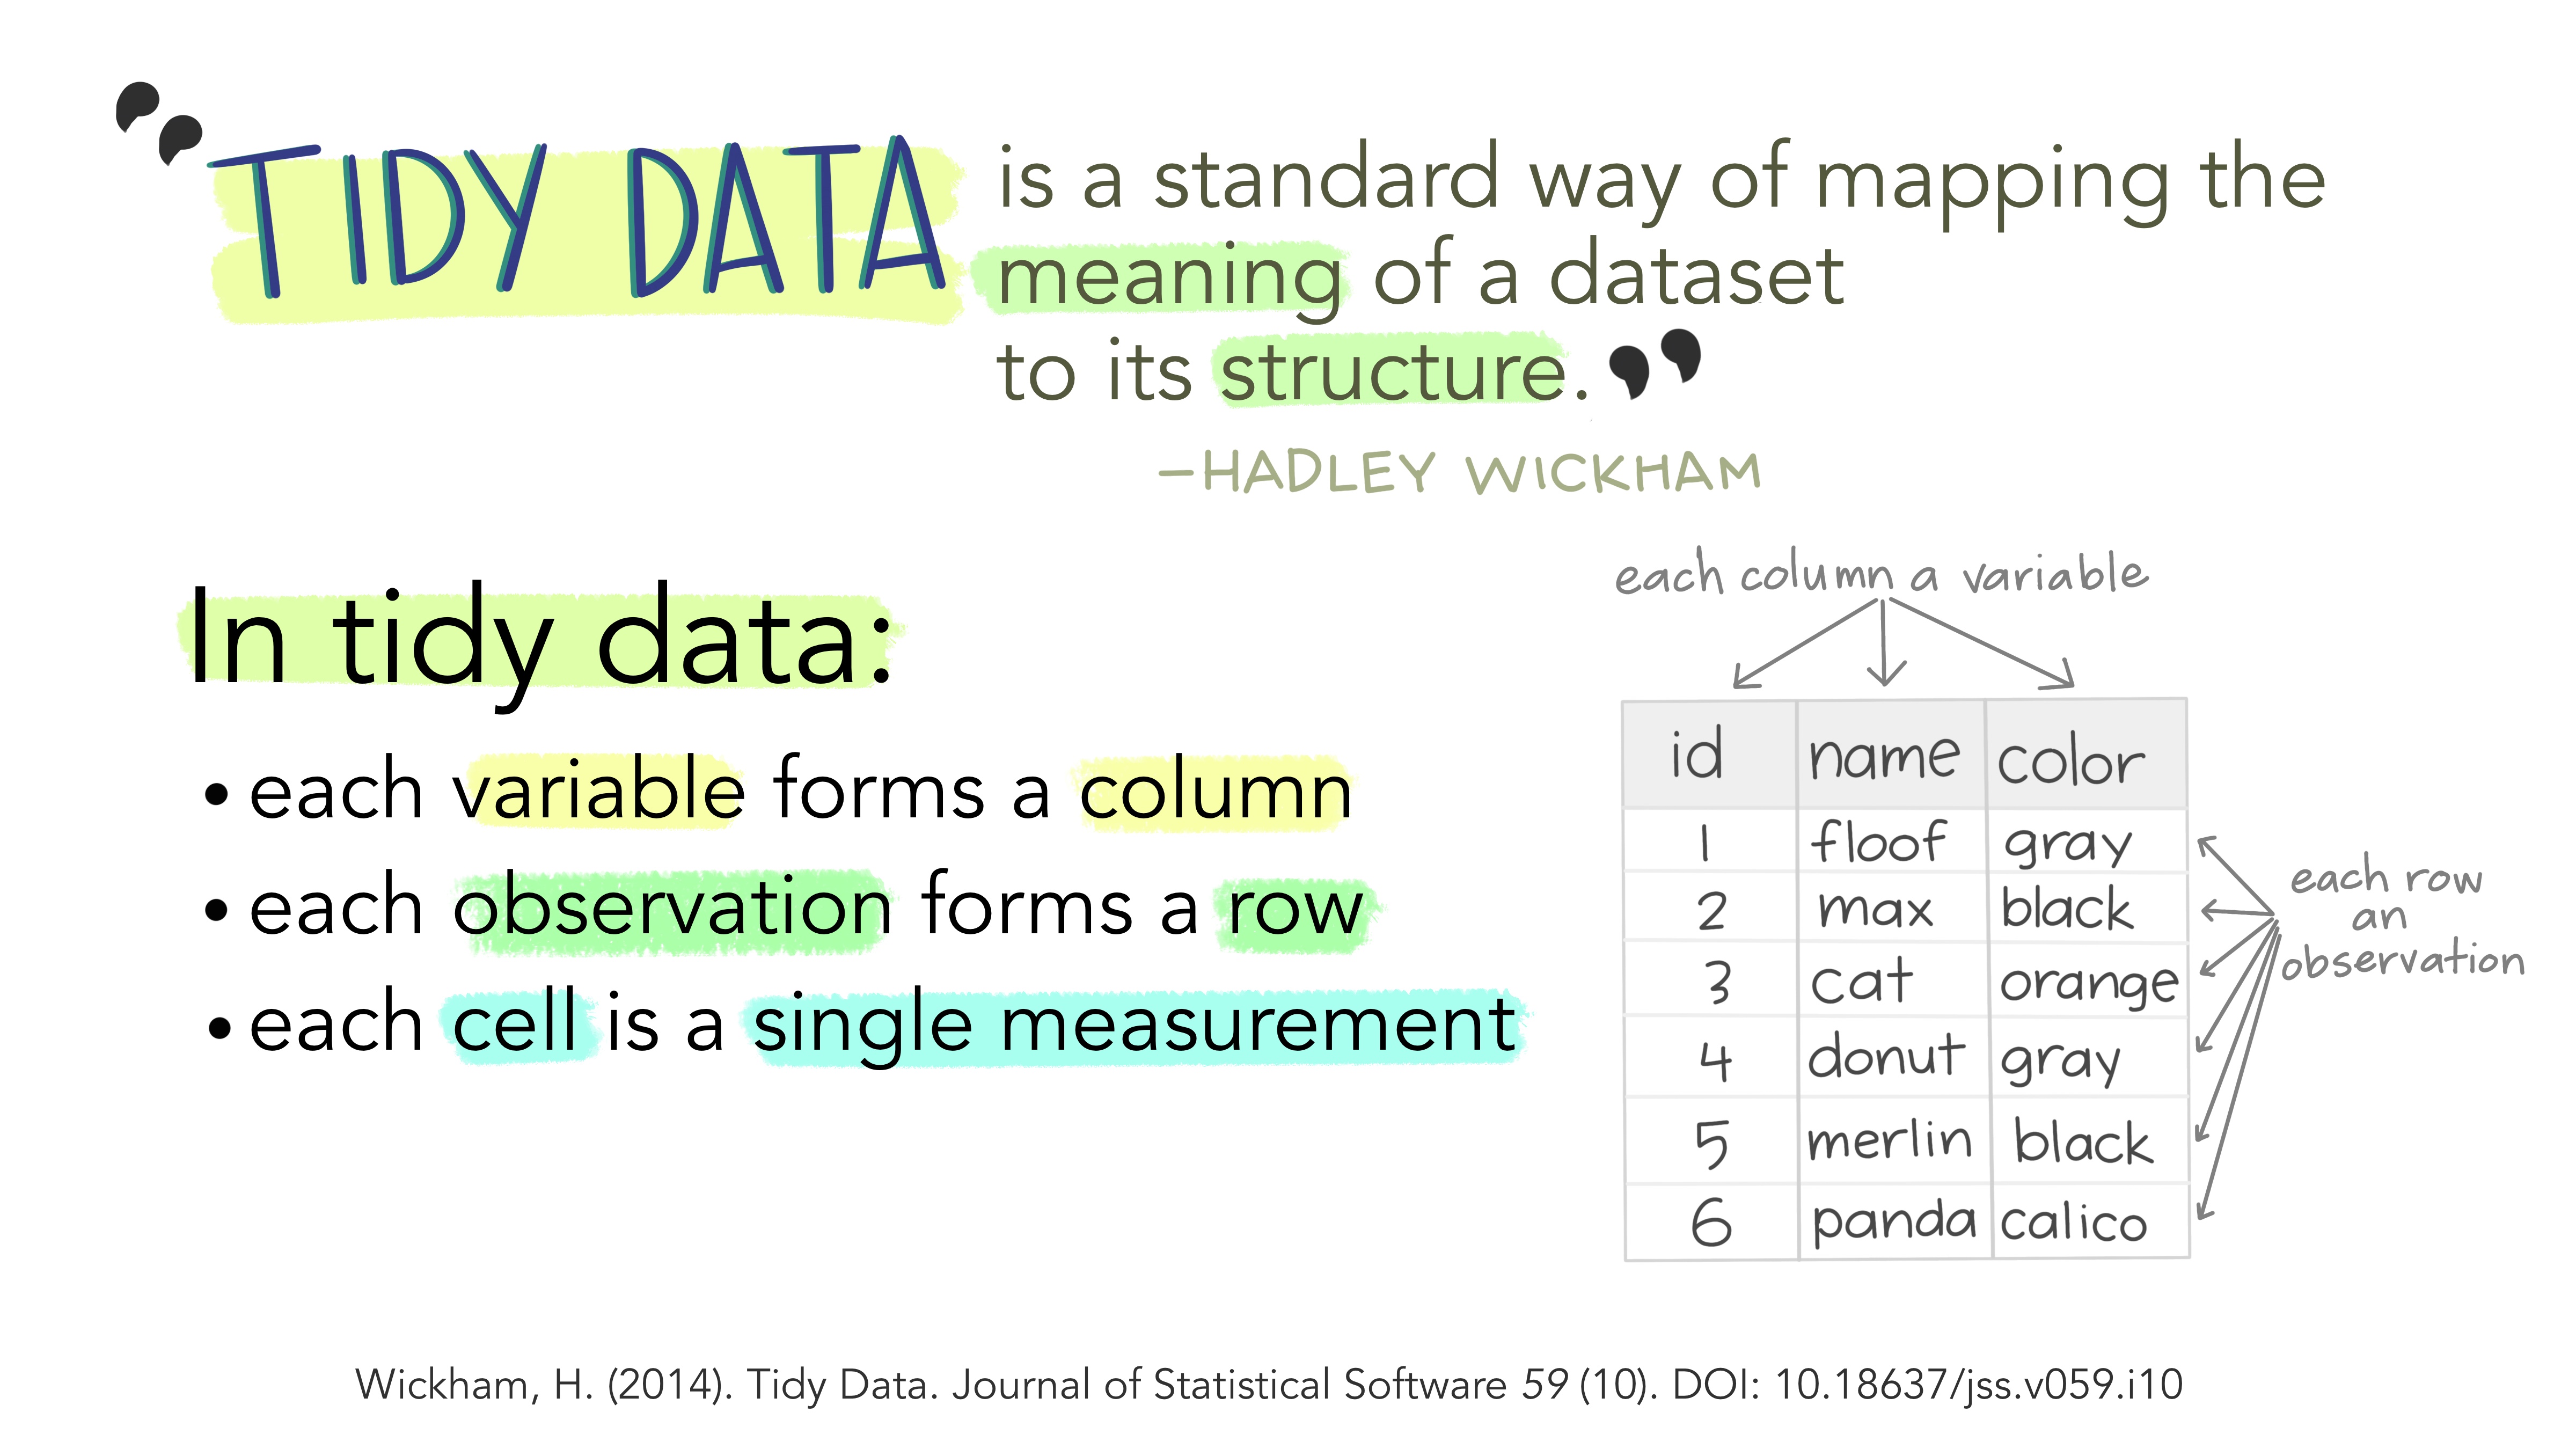
Artwork by @allison_horst
What is tidy data?
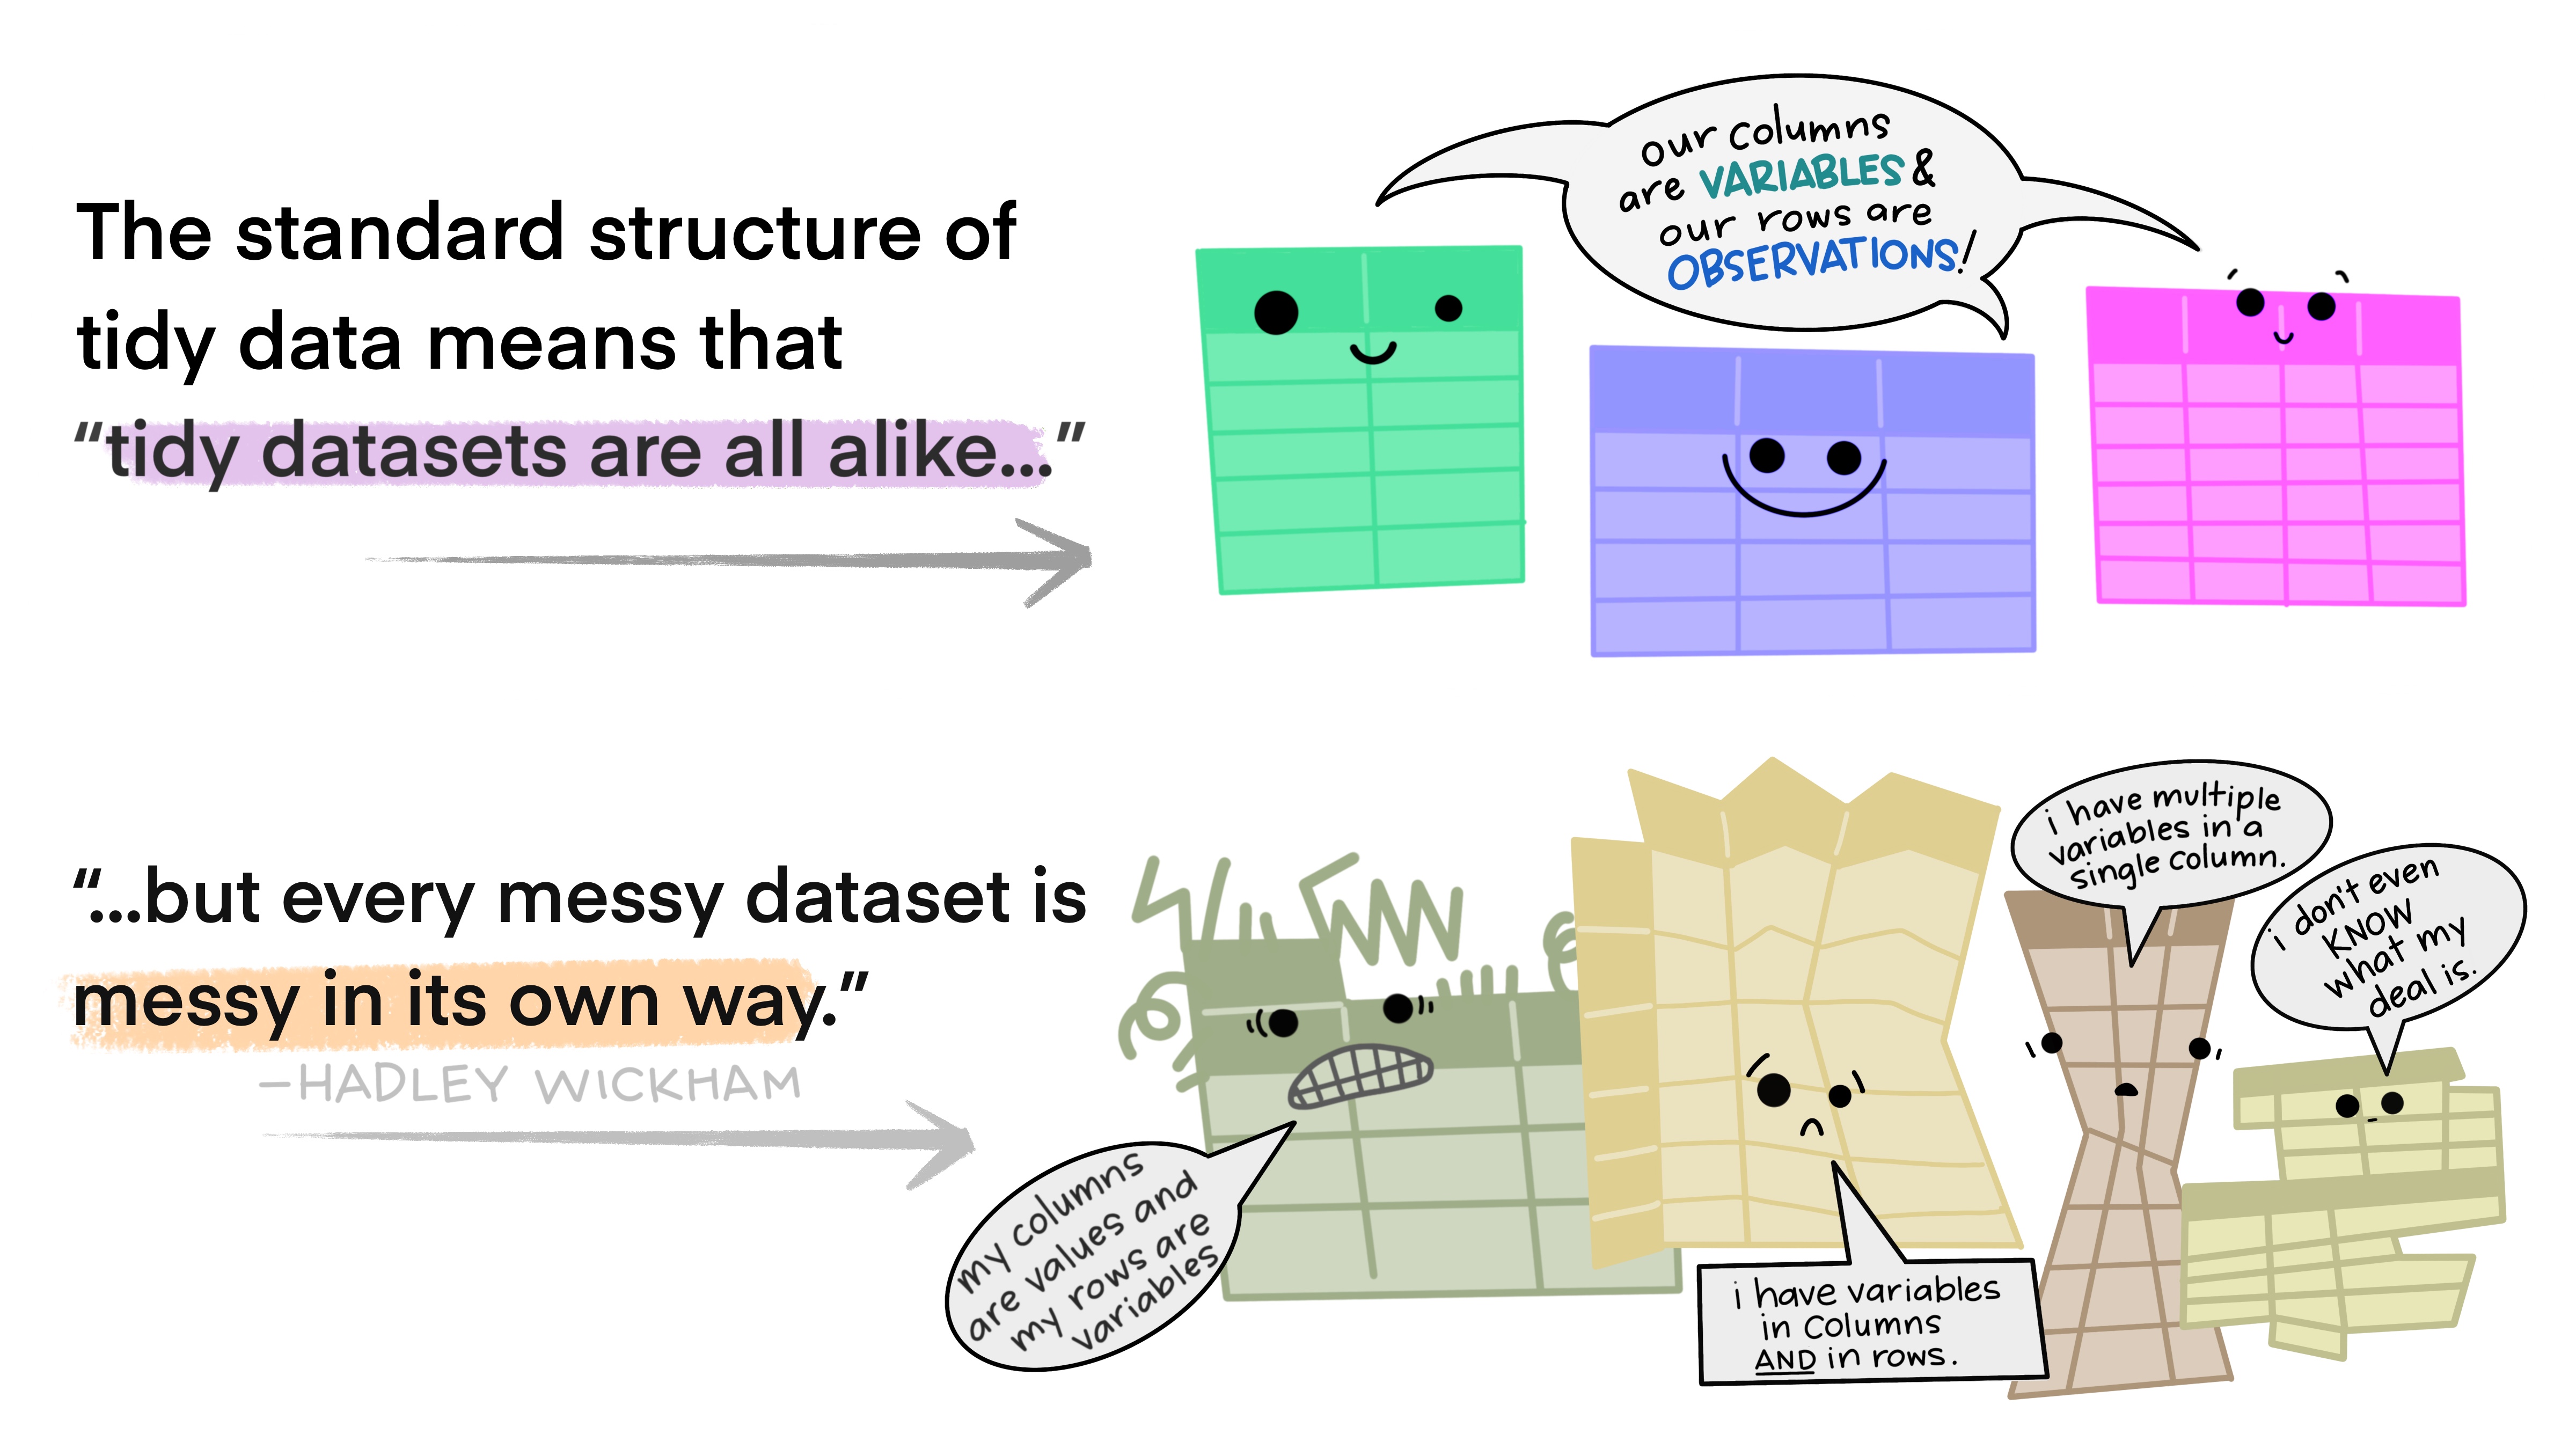
Artwork by @allison_horst
What is tidy data?
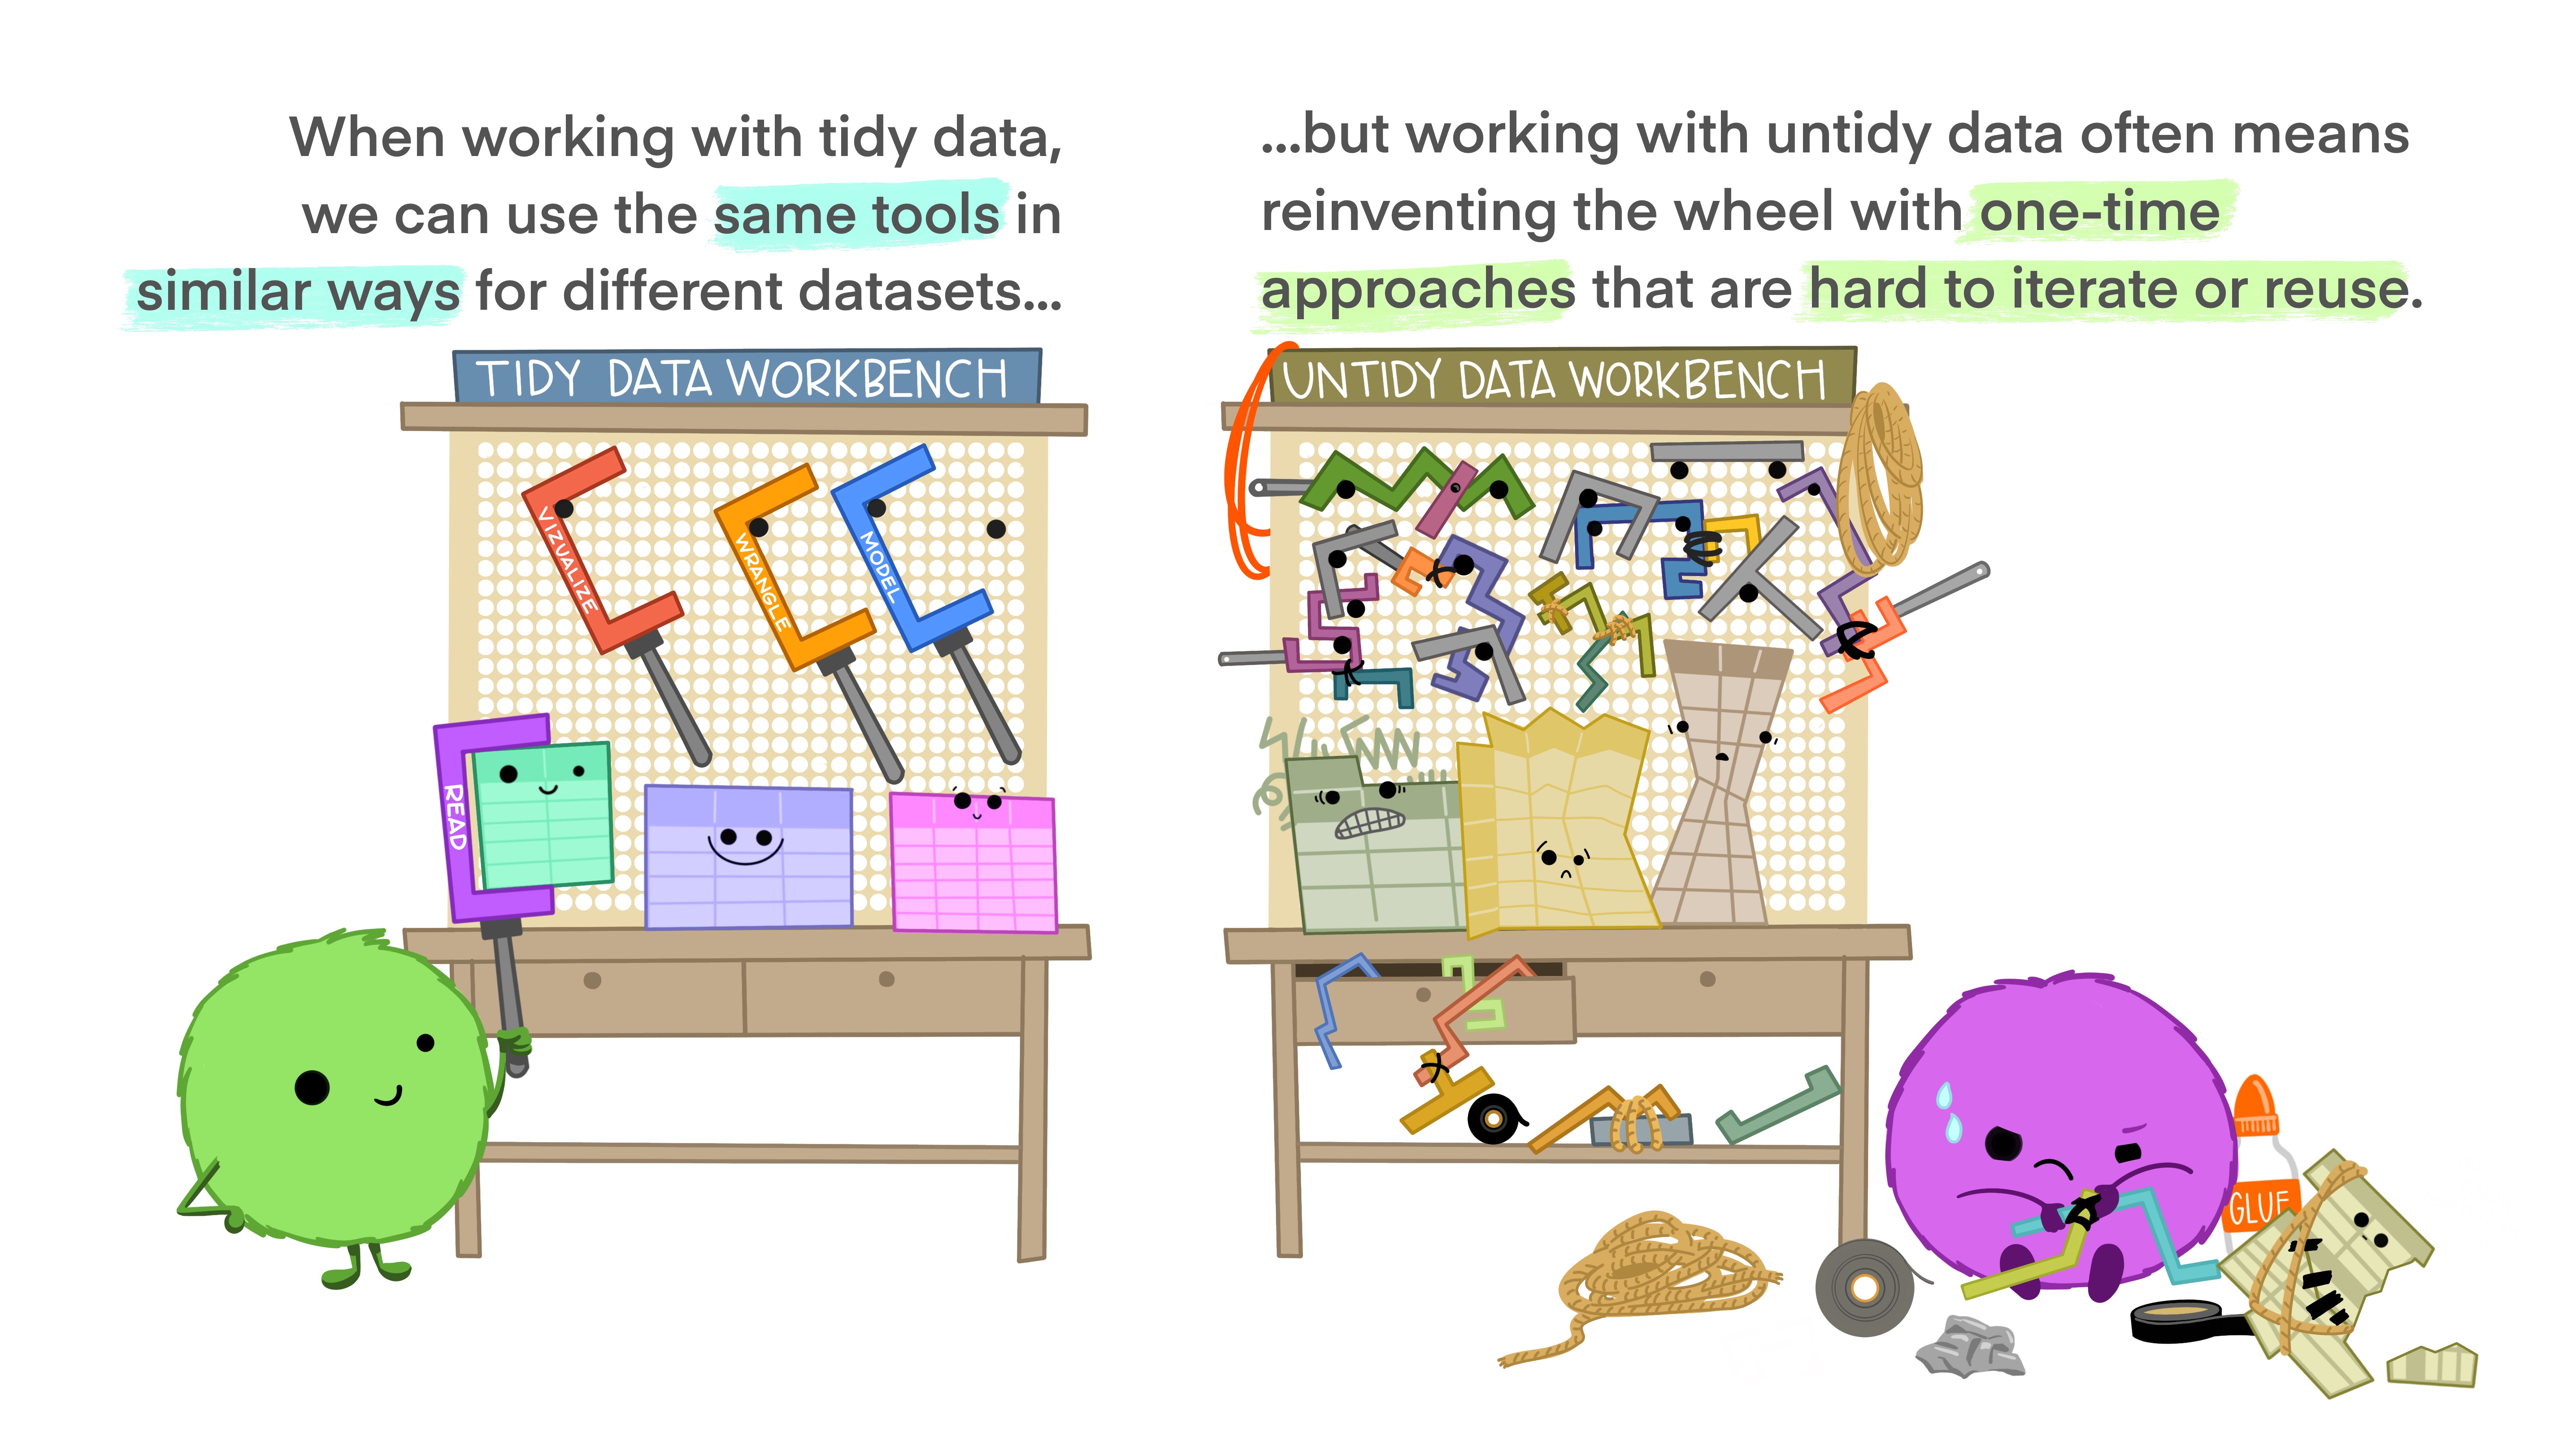
Artwork by @allison_horst
2. The dplyr package
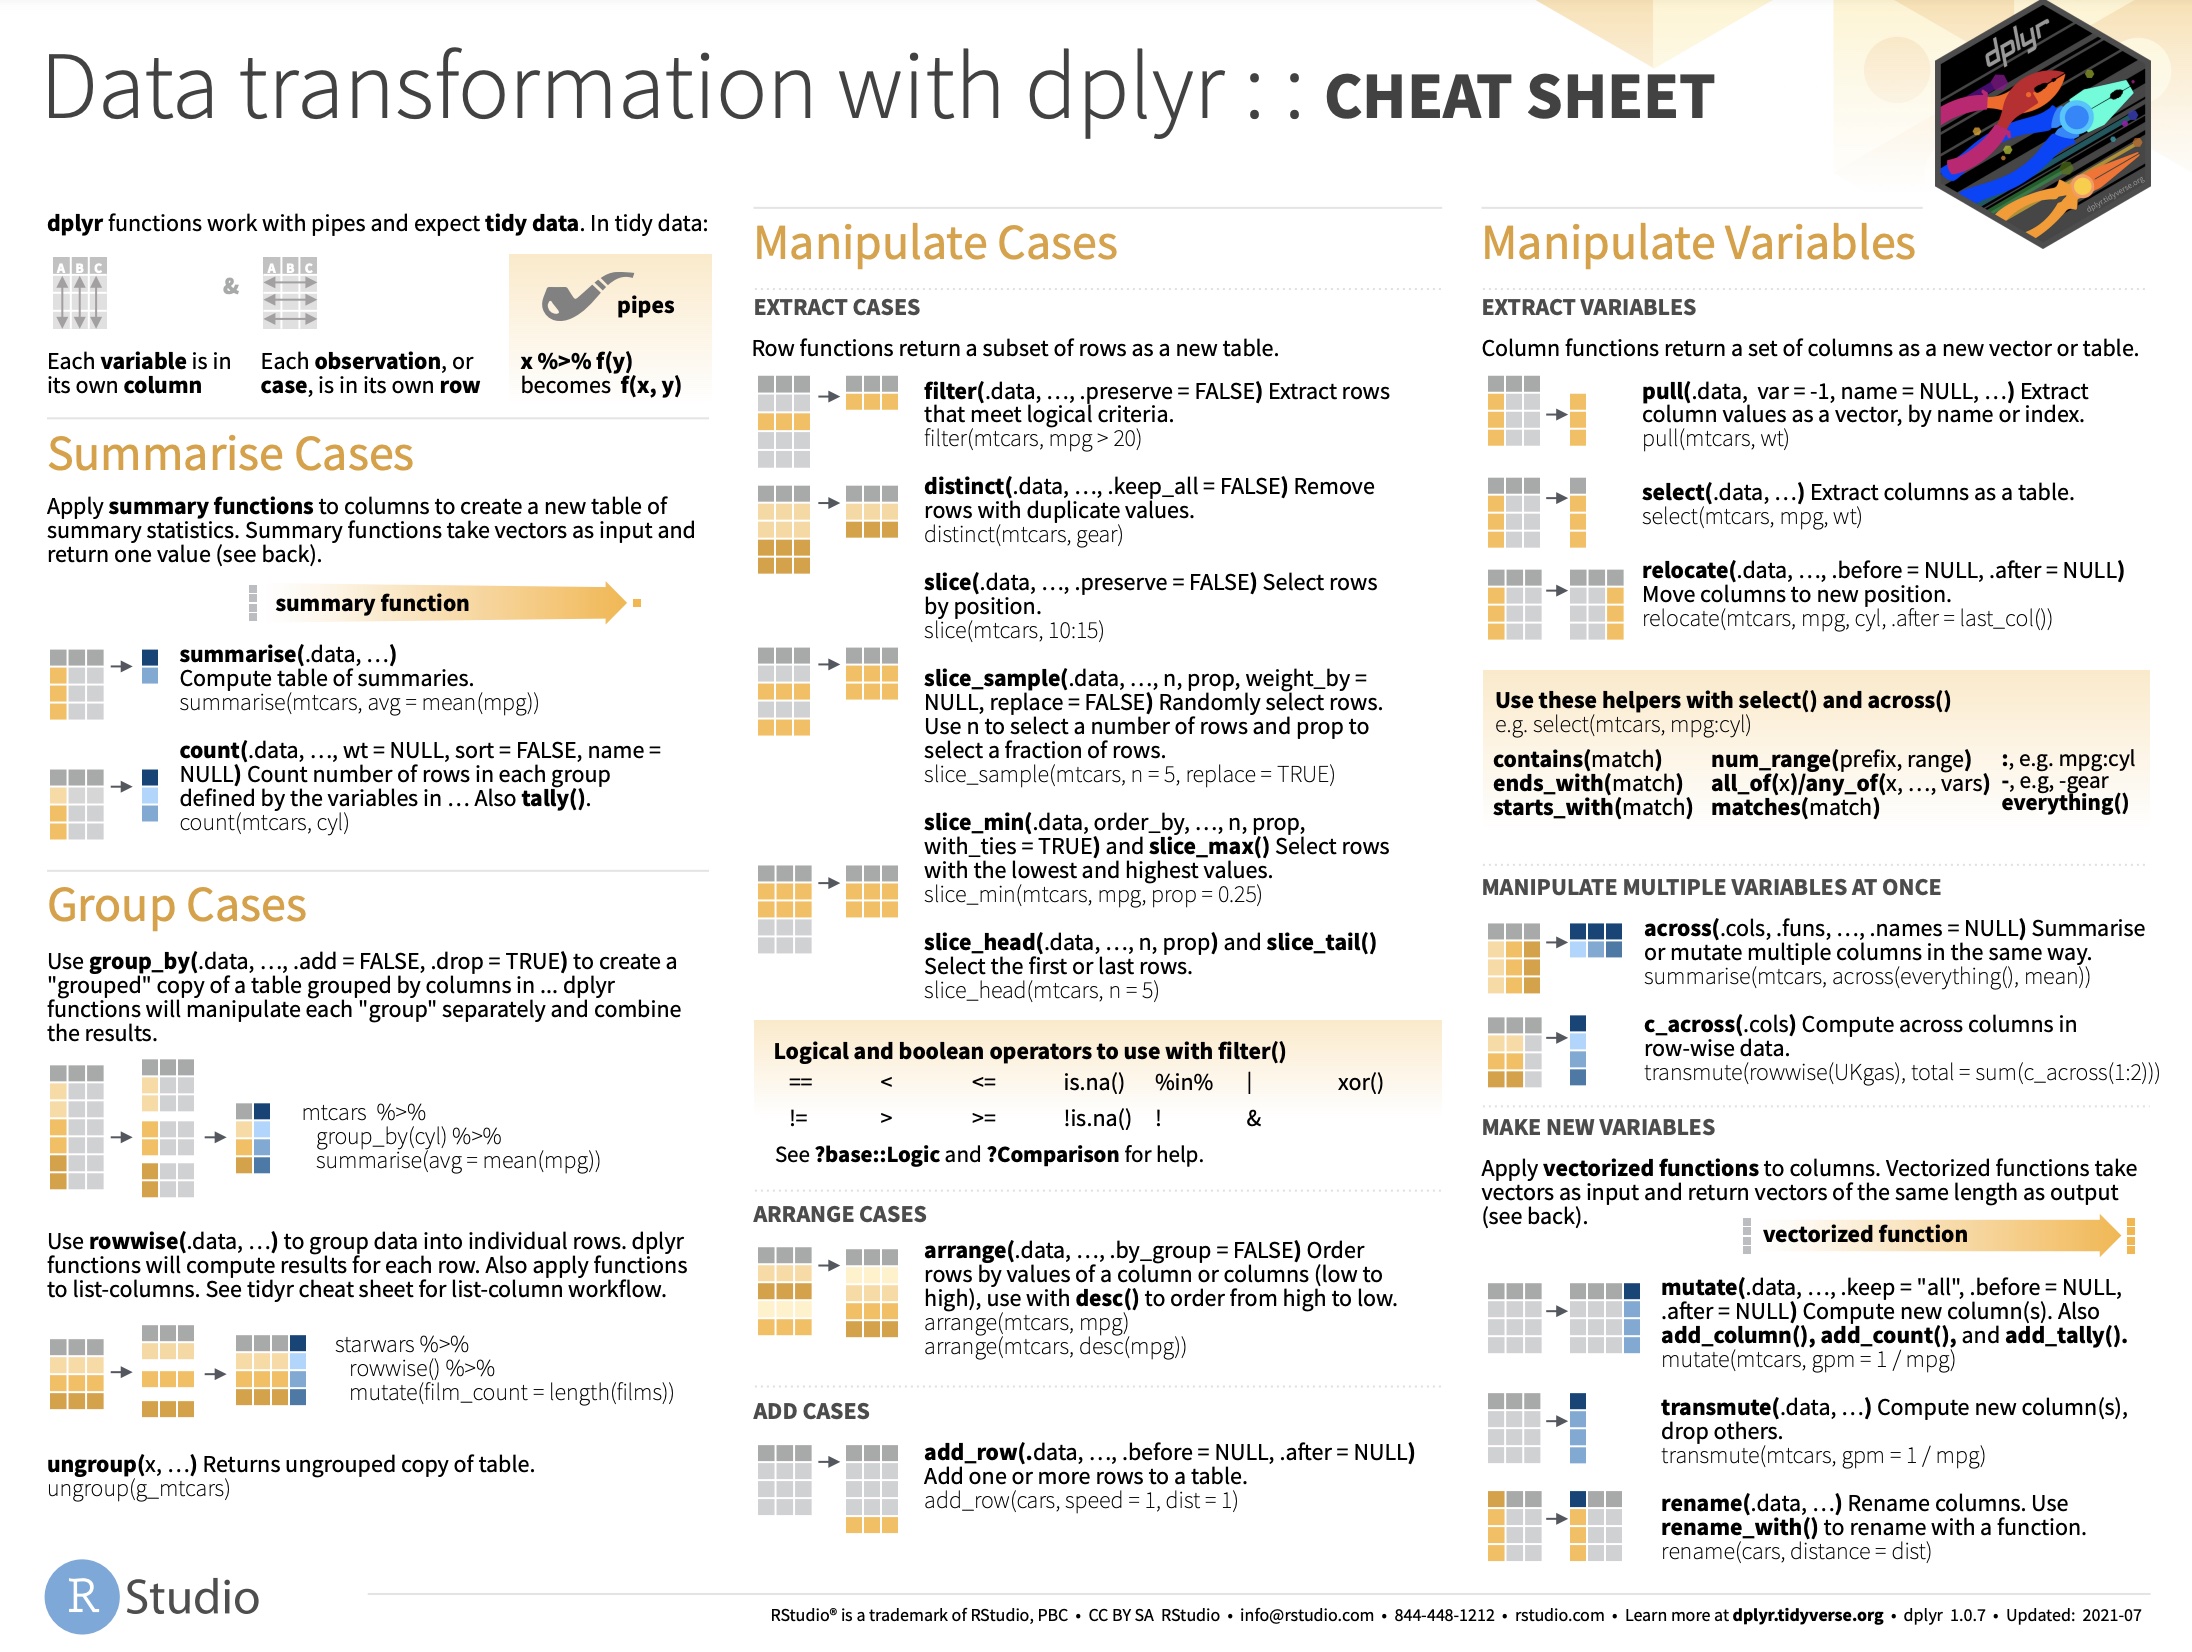
dplyr ...
is THE package to work with tidy data !
VERBS are at the core:
filter()mutate()select()group_by() + summarise()arrange()rename()relocate()join()
The %>% operator (a 'pipe')
To create
a chain of functions
Instead of
mean(c(1,2,3,4))or
Numbers <- c(1,2,3,4)mean(Numbers)you can do
c(1,2,3,4) %>% mean( )With the %>% you can write a sentence like:
I
%>%woke up%>%, took a shower%>%, got breakfast%>%, took the train%>%and arrived at the ICO course%>%…
filter()
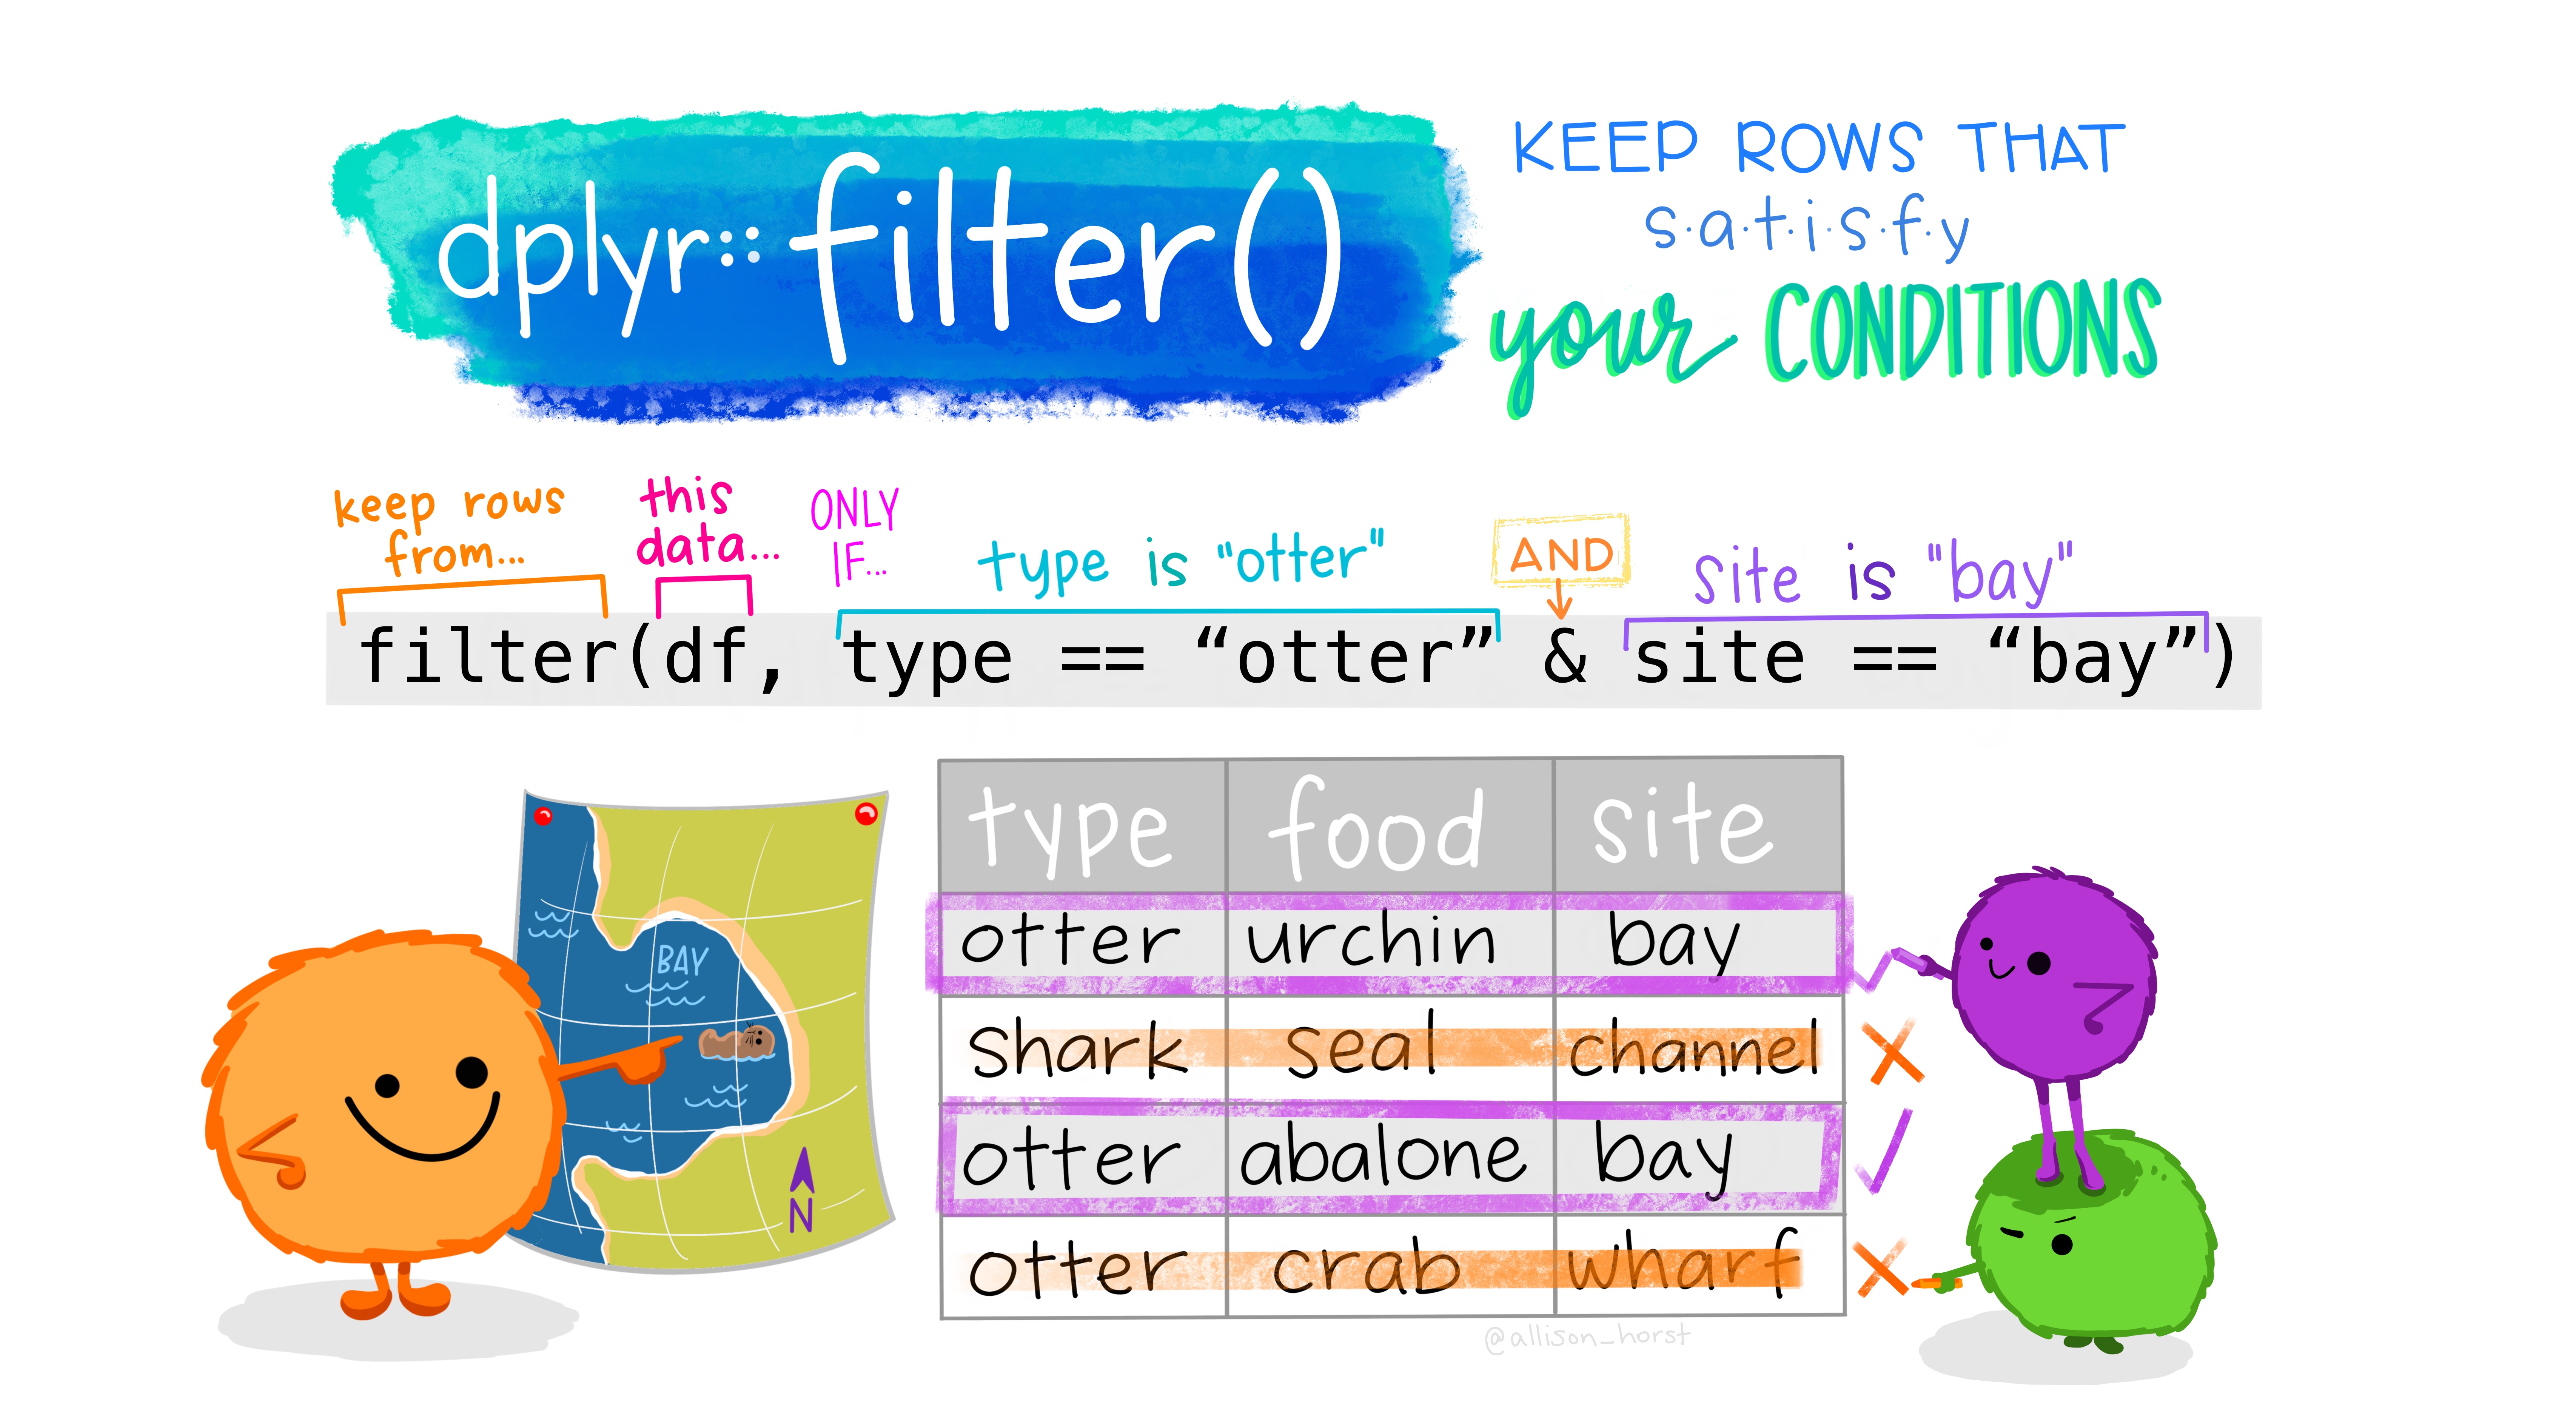
Artwork by @allison_horst
Let's apply filter()
With the FRIENDS data:
We only select observations from the first measurement occassion in condition 1
Friends_Occ1 <- Friends %>% filter(occassion == 1 & condition == 1)== is equals (notice the 2 = signs!)
Let's clean some data, and remove observations with fluency values above 300 and that do not equal fluence value 0
Friends_clean <- Friends %>% filter(fluency < 300 & fluency != 0)!= means not equal to
mutate()
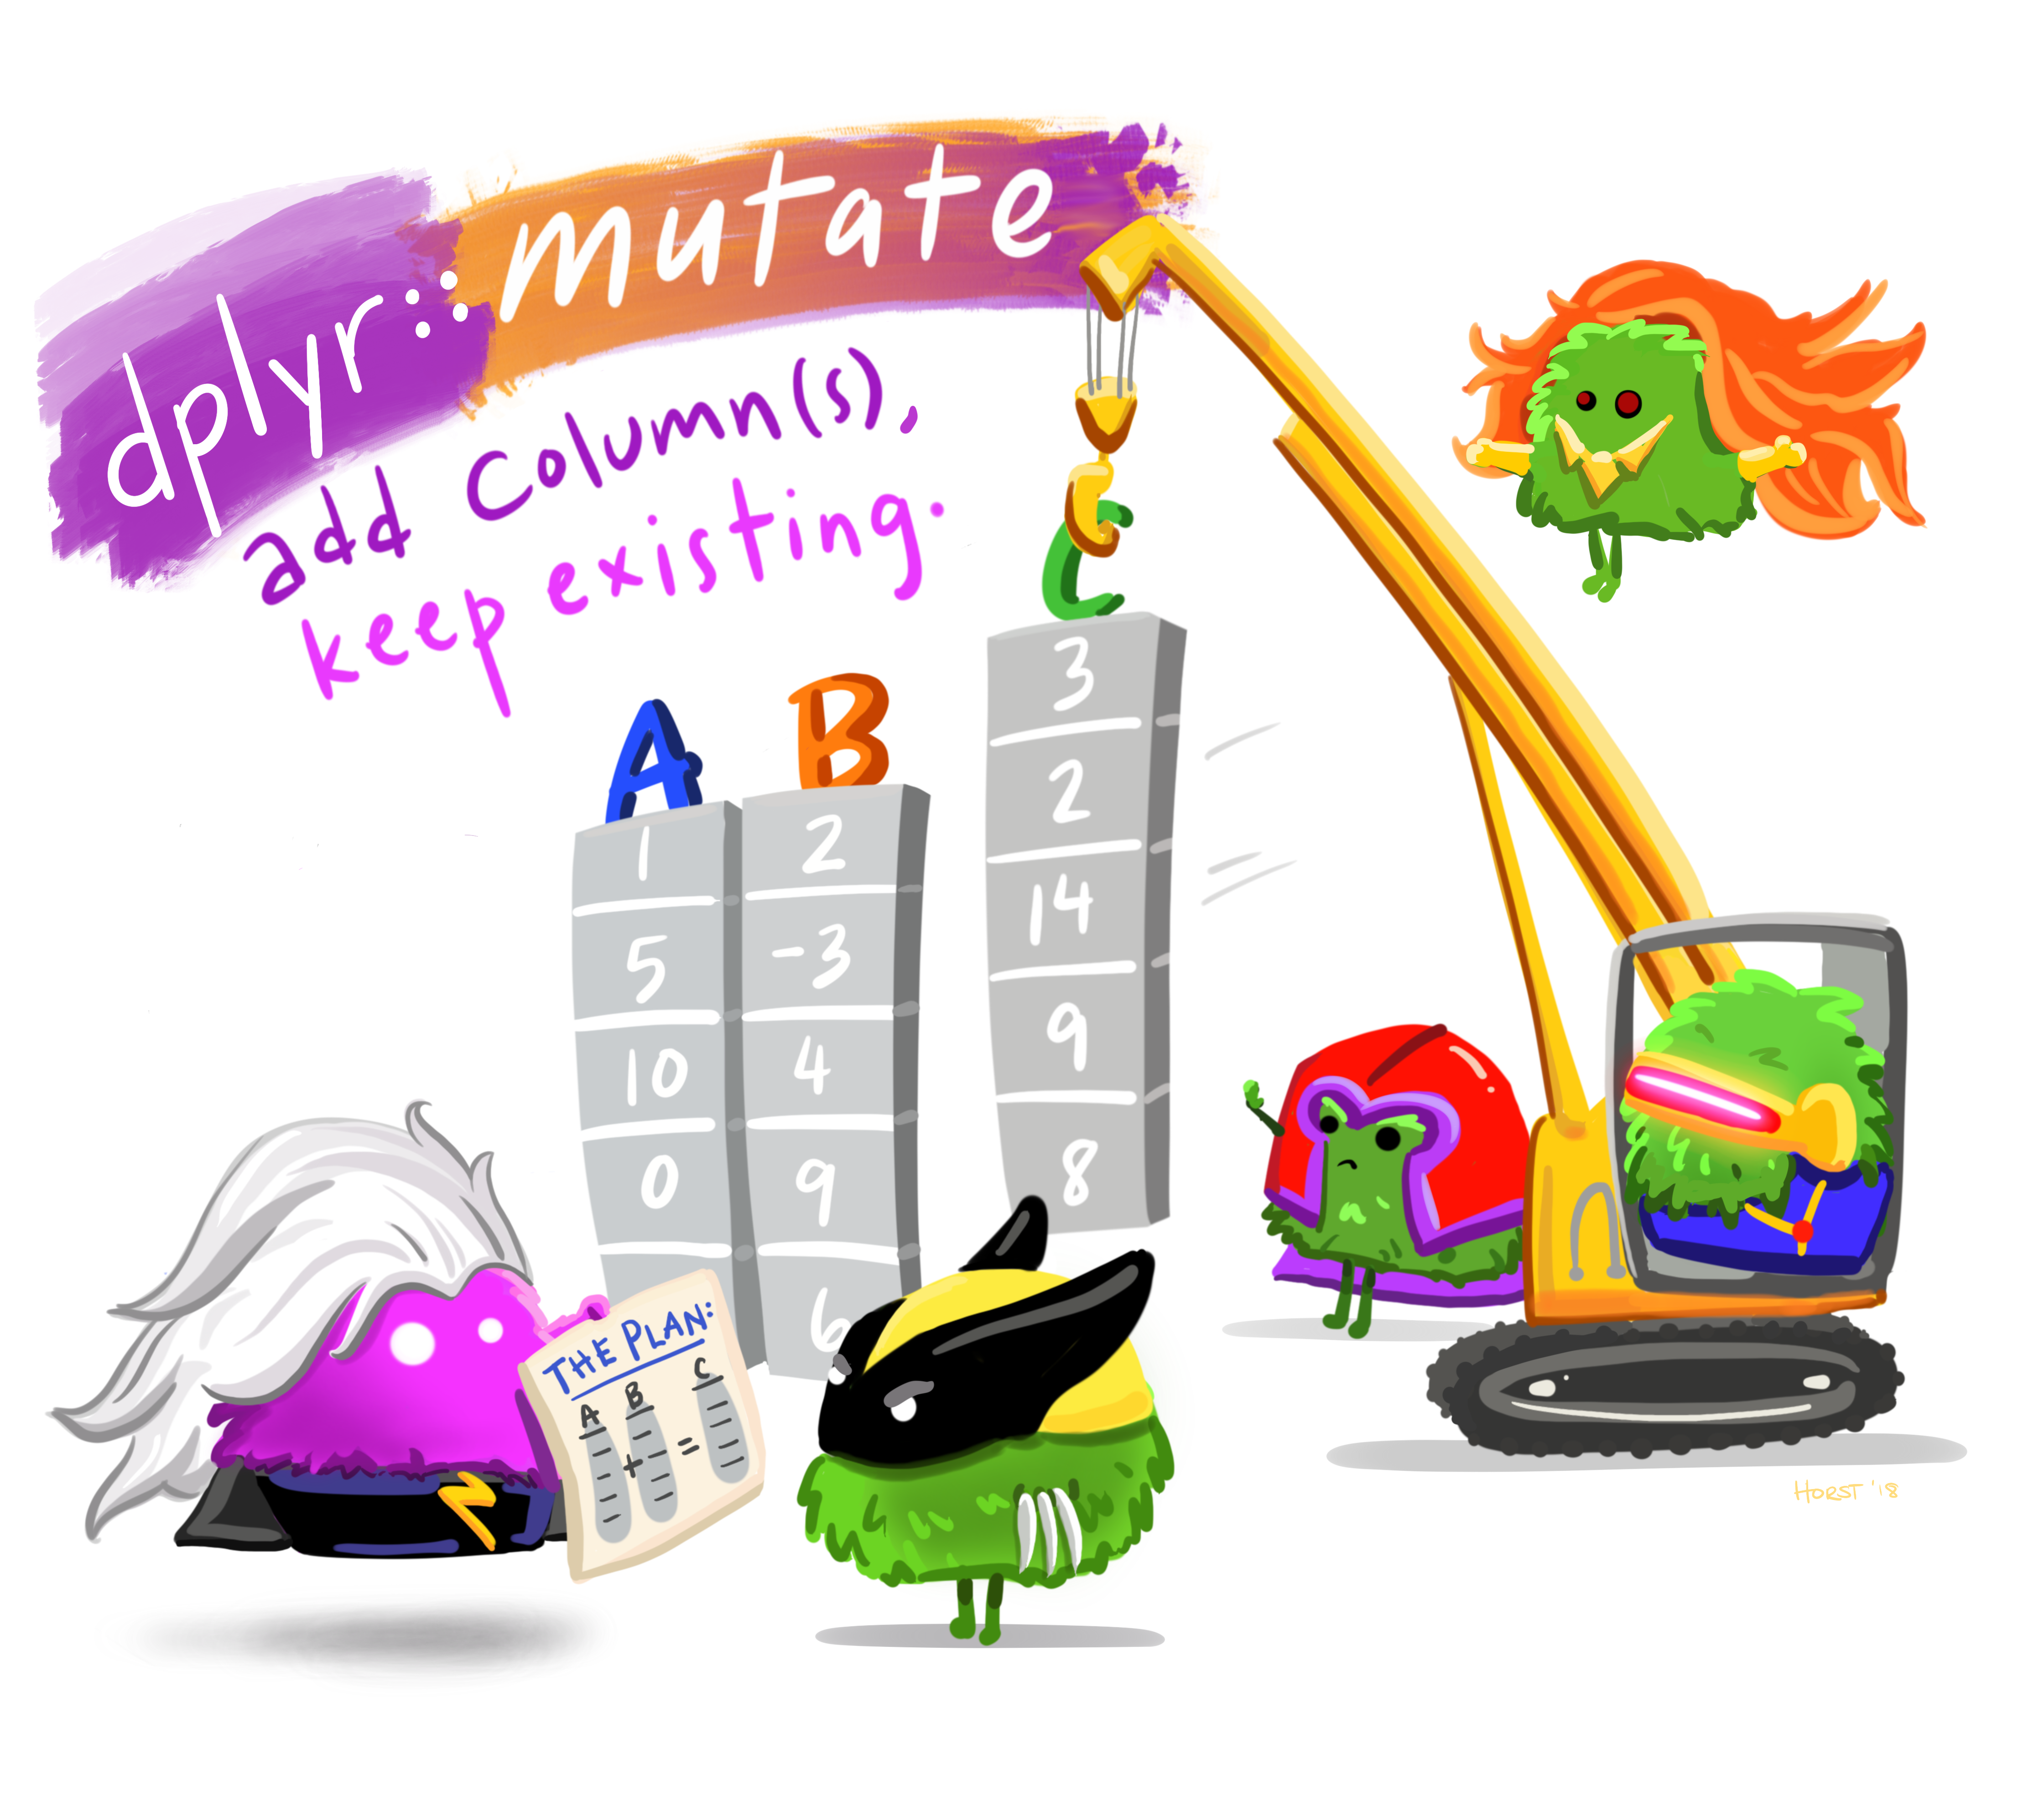
Artwork by @allison_horst
Let's apply mutate()
With the Friends data:
We calculate a new variable containing the fluency scores minus the average of fluency
Friends <- Friends %>% mutate( fluency_centered = fluency - mean(fluency, na.rm = T) )Let's apply mutate()
With the Friends data:
We create a factor for condition
Friends <- Friends %>% mutate( condition_factor = as.factor(condition) )str(Friends$condition_factor)## Factor w/ 3 levels "1","2","3": 1 1 1 2 2 2 3 3 3 1 ...Let's apply select()
To select variables.
Some examples with the Friends data:
We only select
conditionandoccasionand inspect the result with thestr()function
Friends %>% select( condition, occassion ) %>% str()## tibble [108 × 2] (S3: tbl_df/tbl/data.frame)## $ condition: num [1:108] 1 1 1 2 2 2 3 3 3 1 ...## ..- attr(*, "value.labels")= Named chr [1:3] "3" "2" "1"## .. ..- attr(*, "names")= chr [1:3] "No subtitles" "Spanish" "English"## $ occassion: num [1:108] 1 2 3 1 2 3 1 2 3 1 ...## - attr(*, "variable.labels")= Named chr(0) ## ..- attr(*, "names")= chr(0) ## - attr(*, "codepage")= int 1252Rename variables with rename()
Notice how the variable occassion is misspelled! Pretty enoying when coding... But we can easily rename variables.
Function rename(new_name = old_name)
Rename the variable
occassiontooccasion
Friends <- Friends %>% rename( occasion = occassion )Super combo 1: group_by() + summarize( )
transform a tibble to a grouped tibble making use of
group_by()calculate summary stats per group making use of
summarize()
Calculate the average fluency and standard deviation per condition
Friends %>% group_by( condition ) %>% summarize( mean_fluency = mean(fluency), sd_fluency = sd(fluency) )## # A tibble: 3 × 3## condition mean_fluency sd_fluency## <dbl> <dbl> <dbl>## 1 1 109. 9.08## 2 2 108. 6.02## 3 3 103. 4.17Super combo 1: group_by() + summarize( )
Calculate the number of observations for each combination of condition and occasion
Friends %>% group_by( occasion, condition ) %>% summarize( n_observations = n() )## # A tibble: 9 × 3## # Groups: occasion [3]## occasion condition n_observations## <dbl> <dbl> <int>## 1 1 1 12## 2 1 2 12## 3 1 3 12## 4 2 1 12## 5 2 2 12## 6 2 3 12## 7 3 1 12## 8 3 2 12## 9 3 3 12Super combo 2: mutate() + case_when( )
Artwork by @allison_horst
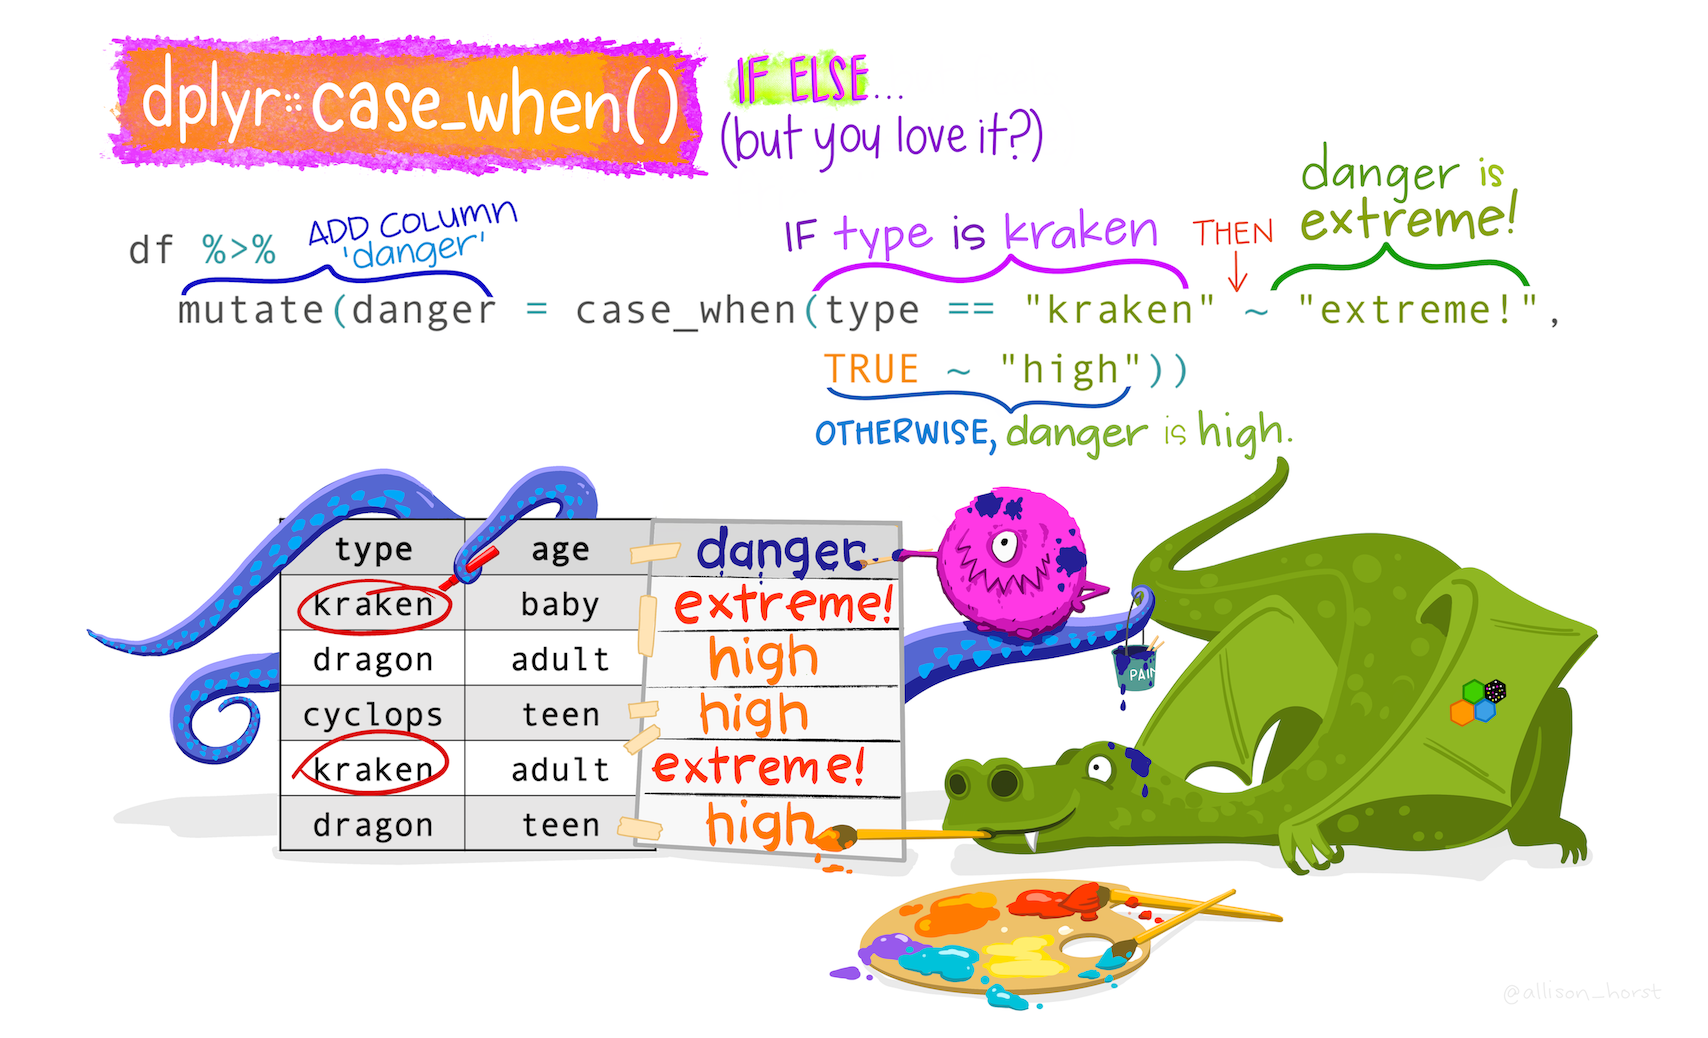
Super combo 2: mutate() + case_when( )
To recode variables into new variables!
We create a new categorical variant of fluency with 3 groups, then we select this new variable and have a look to the top 5 observations...
Friends %>% mutate( fluency_grouped = case_when( fluency < 106.625 - 7.1 ~ 'low', fluency >= 106.625 - 7.1 & fluency < 106.625 + 7.1 ~ 'average', fluency >= 106.625 + 7.1 ~ 'high' ) ) %>% select( fluency, fluency_grouped ) %>% head(5)## # A tibble: 5 × 2## fluency fluency_grouped## <dbl> <chr> ## 1 101. average ## 2 104. average ## 3 117. high ## 4 98.8 low ## 5 107. averageHow to define conditions
x == y→ 'x is equal to y'x != y→ 'x is NOT equal to y'x < y→ 'x is smaller than y'x <= y→ 'x is smaller or equal to y'x > y→ 'x is higher than y'x >= y→ 'x is higher or equal to y'
Bolean operators
We can combine conditions!
&→ 'and' → example:gender == 1 & age <=18|→ 'or' → example:gender == 1 | gender == 2!→ 'not' → example:gender == 1 & !age <=18
Interactive tutorial about dplyr()
If you want some more material and a place to exercise your skills? This online and freetutorial (made with the package learnr) is strongly advised!
https://allisonhorst.shinyapps.io/dplyr-learnr/#section-welcome
Exercise dplyr

You can find the qmd-file
Exercises_dplyr.qmdin the Exercises folder (you created the project yesterday!) (Exercises > Exercise2_dplyr)Open this document
You get a set of tasks with empty code blocks to start coding
Write and test the necessary code
Stuck? No Worries!
- We are there
- Help each other
- There is a solution key (
Exercises_dplyr_solutions.qmd)
