
ICO Workshop R & RStudio
Part 1
Introduction to R and RStudio
2nd - 4th July, 2024
Overzicht
- Some practical stuff --- (click here)
- What is
Rand why should you useR? --- (click here) - Install
R&RStudio--- (click here) RStudiointerface --- (click here)- The basics in
R(click here) - Installing and using packages --- (click here)
- Importing data --- (click here)
- Working with
R-projects --- (click here)
About us
- University of Antwerp; Faculty of Social Sciences; dept. Training- en Education Sciences
- dieha
Rd useRs ofR
About Sven?
- Research interests? Psychometry, writing research, learning strategies, education for sustainable development, linguistics, ...
- Main focus? Comparative Judgement + Learning from comparisons
Blog: https://svendemaeyer.netlify.app/
Twitter: @svawa
github: https://github.com/Sdemaeyer2
About Tine?
- Research interests? Comparative judgement, learning from complementary texts, assessment with technology, replication studies, data visualisation, ...
- Main focus? (Peer) assessment, learning (processes), educational technology, learning analytics
Twitter: @TinevanDaal
github: https://github.com/tvdaal
Getting to now each other...
Your position?
Research?
Expectations?
1. Some practical stuff

Materials
Various types of files:
Rmd-files (for slides) (.Rmd)
Qmd-files (for exercises) (.Qmd)
R-scripts (as example) (.R)
data sets (.sav, .csv, ...)
html-version of slides and exercises (.html)
All these files can be found at the dedicated web-page: https://icoworkshop-rstudio-2024.netlify.app/#quick-overview
At woRk
We will provide you with the necessary information to start coding yourself.
🙏 Make it interactive! Feel free to ask questions!
Of course, we will also put you to woRk! Do you get stuck? Is R not working along?
🙏 Do not hesitate to ask our help!
2. What is R and why should you use R?
What is R?
Powerful tool for:
- Data Science
- Statistical analysis
- Statistical programming
- Data visualisation ...
A 'language'
→ We will have to learn some vocabulary and grammar ...
Why R?
Free AND open source!
In constant development
Thousands of "add-ins" (packages)
Almost every algorithm and technique is implemented in
RRis ahead of commercial statistical softwareCan facilitate reproducibility and open science practices
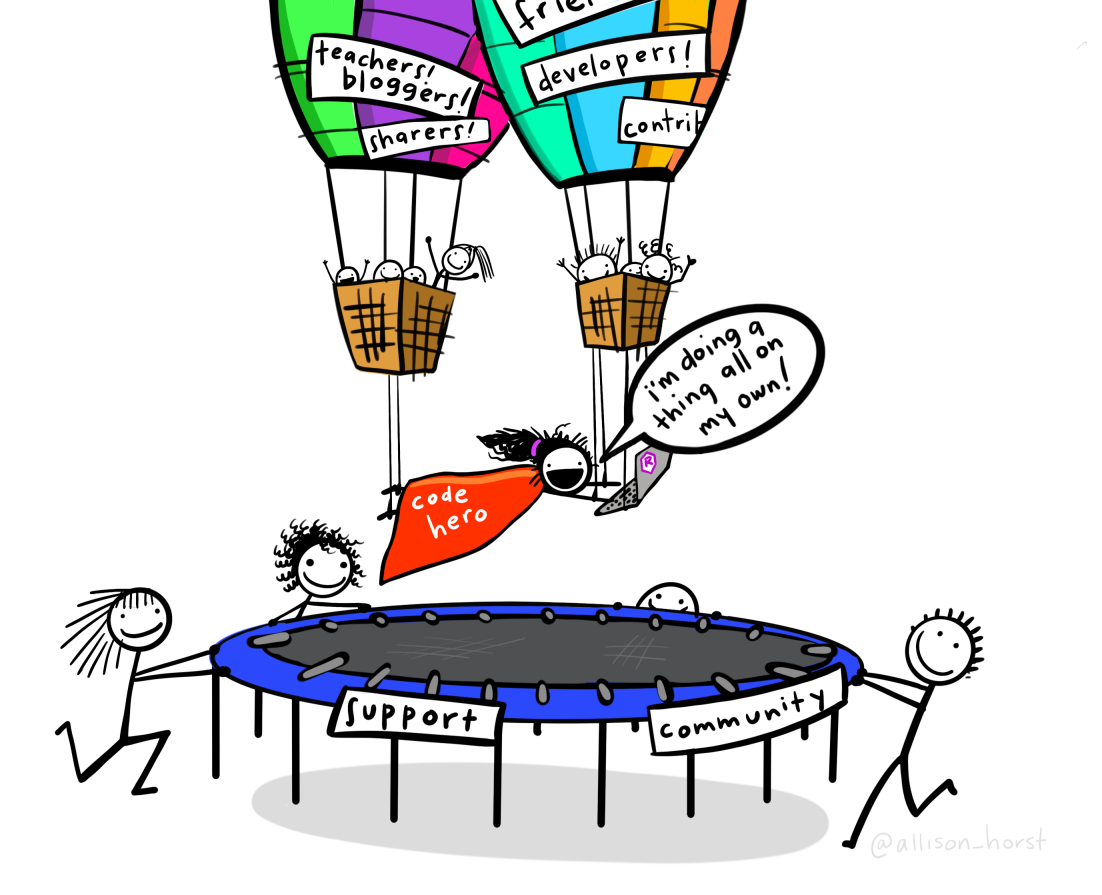
Large community (Help will always be given ...)
3. Install R and RStudio
Install R
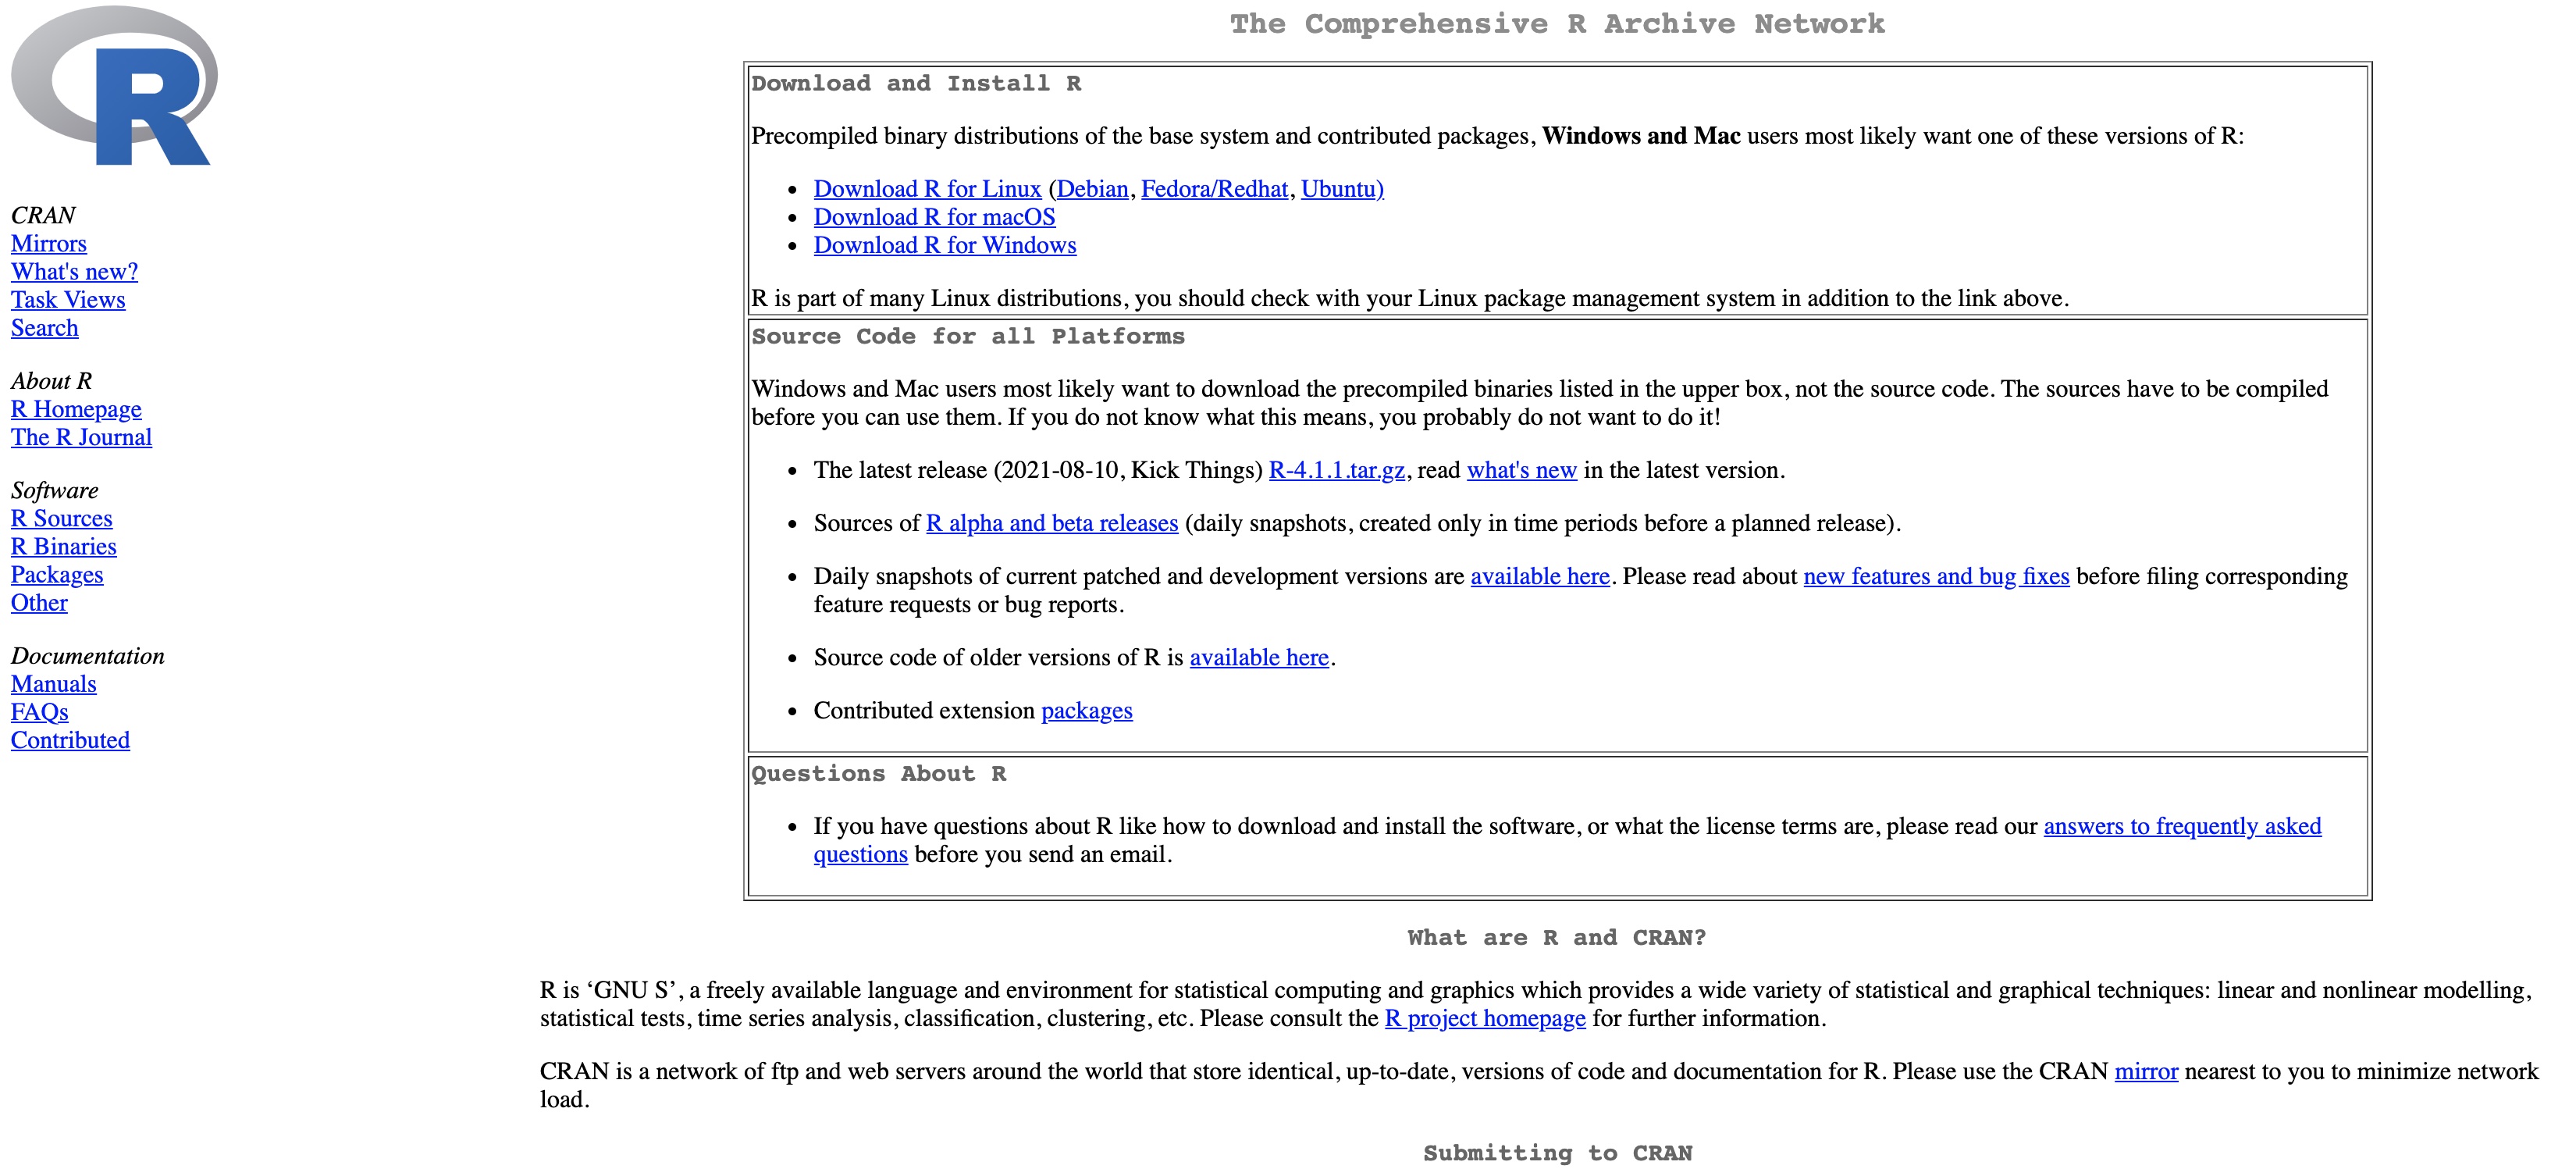
In case you haven't already installed R. Do it now! Are you stuck? Let us know.
A quick tour in R ...

Install RStudio
Click on Download RStudio
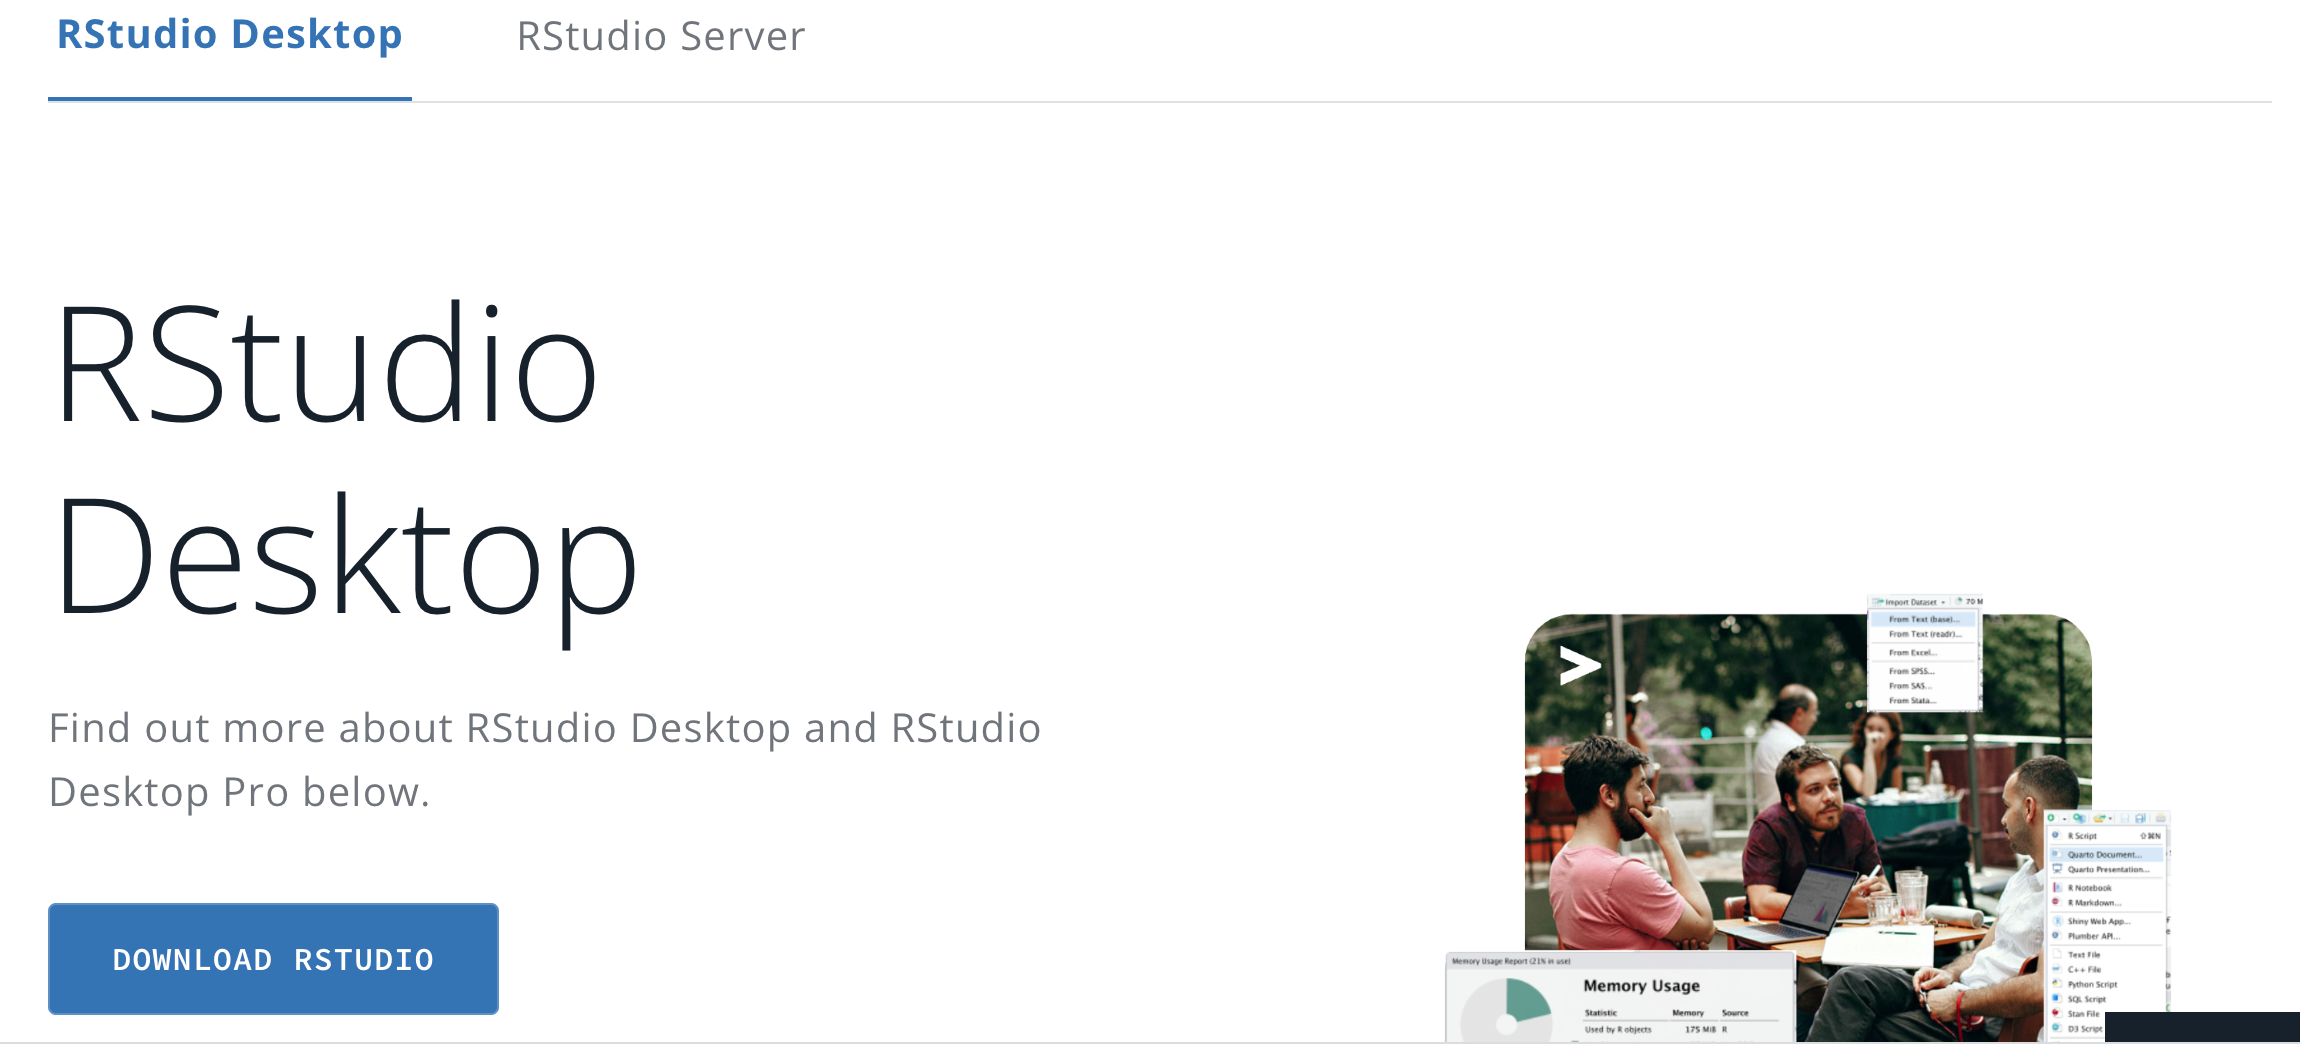

Install RStudio
Scroll down
Click on Download RStudio
Choose the right operating and download RStudio

In case you haven't already installed RStudio. Do it now! Are you stuck? Let us know.
4. RStudio interface
RStudio environment
Let us discover RStudio together!
5. The basics in R
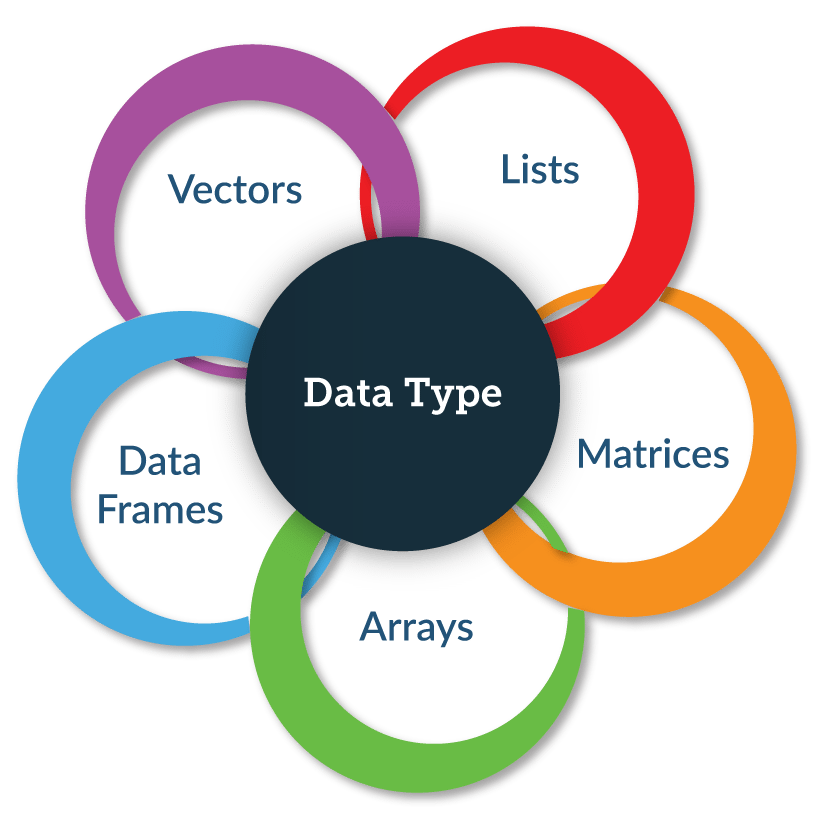
Type of objects
vectors
matrices
arrays
data frames
lists
functions
...
First steps in R ; let's make a script ...
Time to get started with the real work and code together
You can find the code on the next slides.
There is also a script Fruit.R that contains the same code (see course material for Part 1 online)
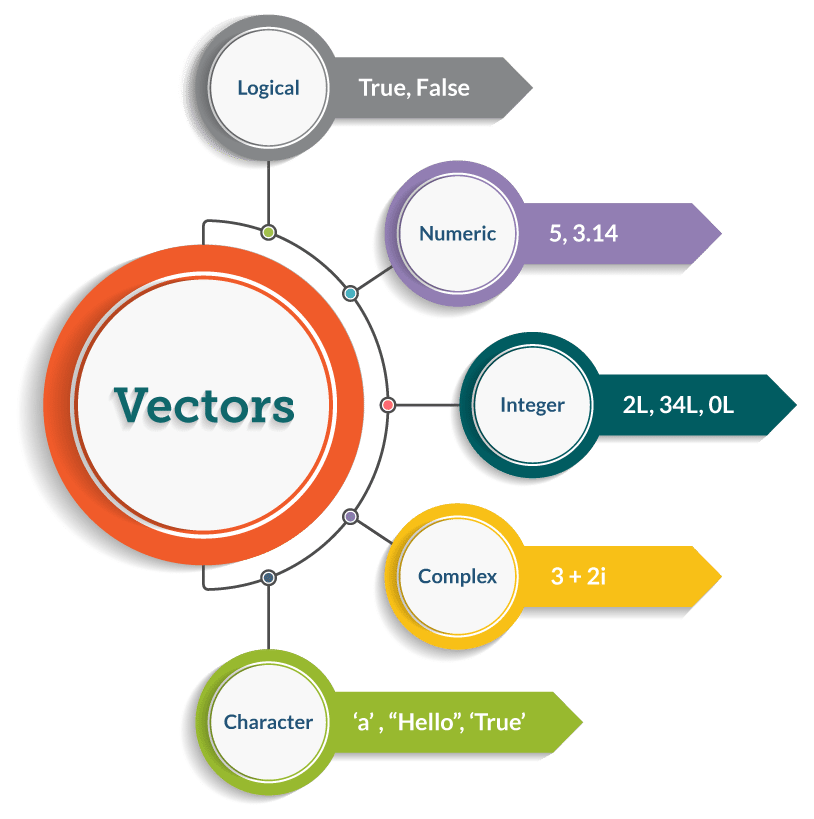
Code-Blocks: character vector
We create a vector and call it Fruit
Fruit <- c("Apples", "Bananas", "Lemons", "Berries", "Peaches", NA)c()represents concatenate, all elements between the brackets ( separated by,) are 'merged' into one element<-means that we want to store the result in an object (a vector) that we callFruitthe
" "that surround the elements indicate that these are of the type character
Let's look at the object Fruit by printing it to the console
Fruit## [1] "Apples" "Bananas" "Lemons" "Berries" "Peaches" NAstr()** function
str(Fruit)## chr [1:6] "Apples" "Bananas" "Lemons" "Berries" "Peaches" NACode-Blocks: numeric vector
We create a vector called Weight
Weight <- c(230, 191, 93, 100, 48, 244)In this case, the elements are 'recorded' as numeric elements
str(Weight)## num [1:6] 230 191 93 100 48 244Now, we can start calculating... For example, we can apply the function
mean( )
mean(Weight)## [1] 151Code-Blocks: logical vector
We create a vector called Yellow
Yellow <- c(F, T, T, F, F, F)
The element of the vector Yellow are 'logical operators' (TRUE or FALSE)
str(Yellow)## logi [1:6] FALSE TRUE TRUE FALSE FALSE FALSE
Let us have a closer look at the vector Yellow
Yellow## [1] FALSE TRUE TRUE FALSE FALSE FALSECode-Blocks: a data frame
We create a data.frame called Fruit_data using the function data.frame( )
Fruit_data <- data.frame(Fruit, Weight, Yellow)Let's have a look at *Fruit_data*
Fruit_data## Fruit Weight Yellow## 1 Apples 230 FALSE## 2 Bananas 191 TRUE## 3 Lemons 93 TRUE## 4 Berries 100 FALSE## 5 Peaches 48 FALSE## 6 <NA> 244 FALSEWe can check the structure of the object Fruit_data
str(Fruit_data)## 'data.frame': 6 obs. of 3 variables:## $ Fruit : chr "Apples" "Bananas" "Lemons" "Berries" ...## $ Weight: num 230 191 93 100 48 244## $ Yellow: logi FALSE TRUE TRUE FALSE FALSE FALSECode-Blocks: subsetting a data frame
The $ operator is used to refer to a vector
Fruit_data$Weight## [1] 230 191 93 100 48 244[row, column]
Examples of indexing:
Retrieve element that is located at row 1 and column 1
Fruit_data[1,1]## [1] "Apples"Retrieve all elements in column 3
Fruit_data[,3]## [1] FALSE TRUE TRUE FALSE FALSE FALSERetrieve all elements in row 3
Fruit_data[3,]## Fruit Weight Yellow## 3 Lemons 93 TRUE
6. Install and use packages
Packages?
The unive
Rsum is in constant developmentPackage = extensions of the
Base-functionsRange from specialised to generic/universal packages
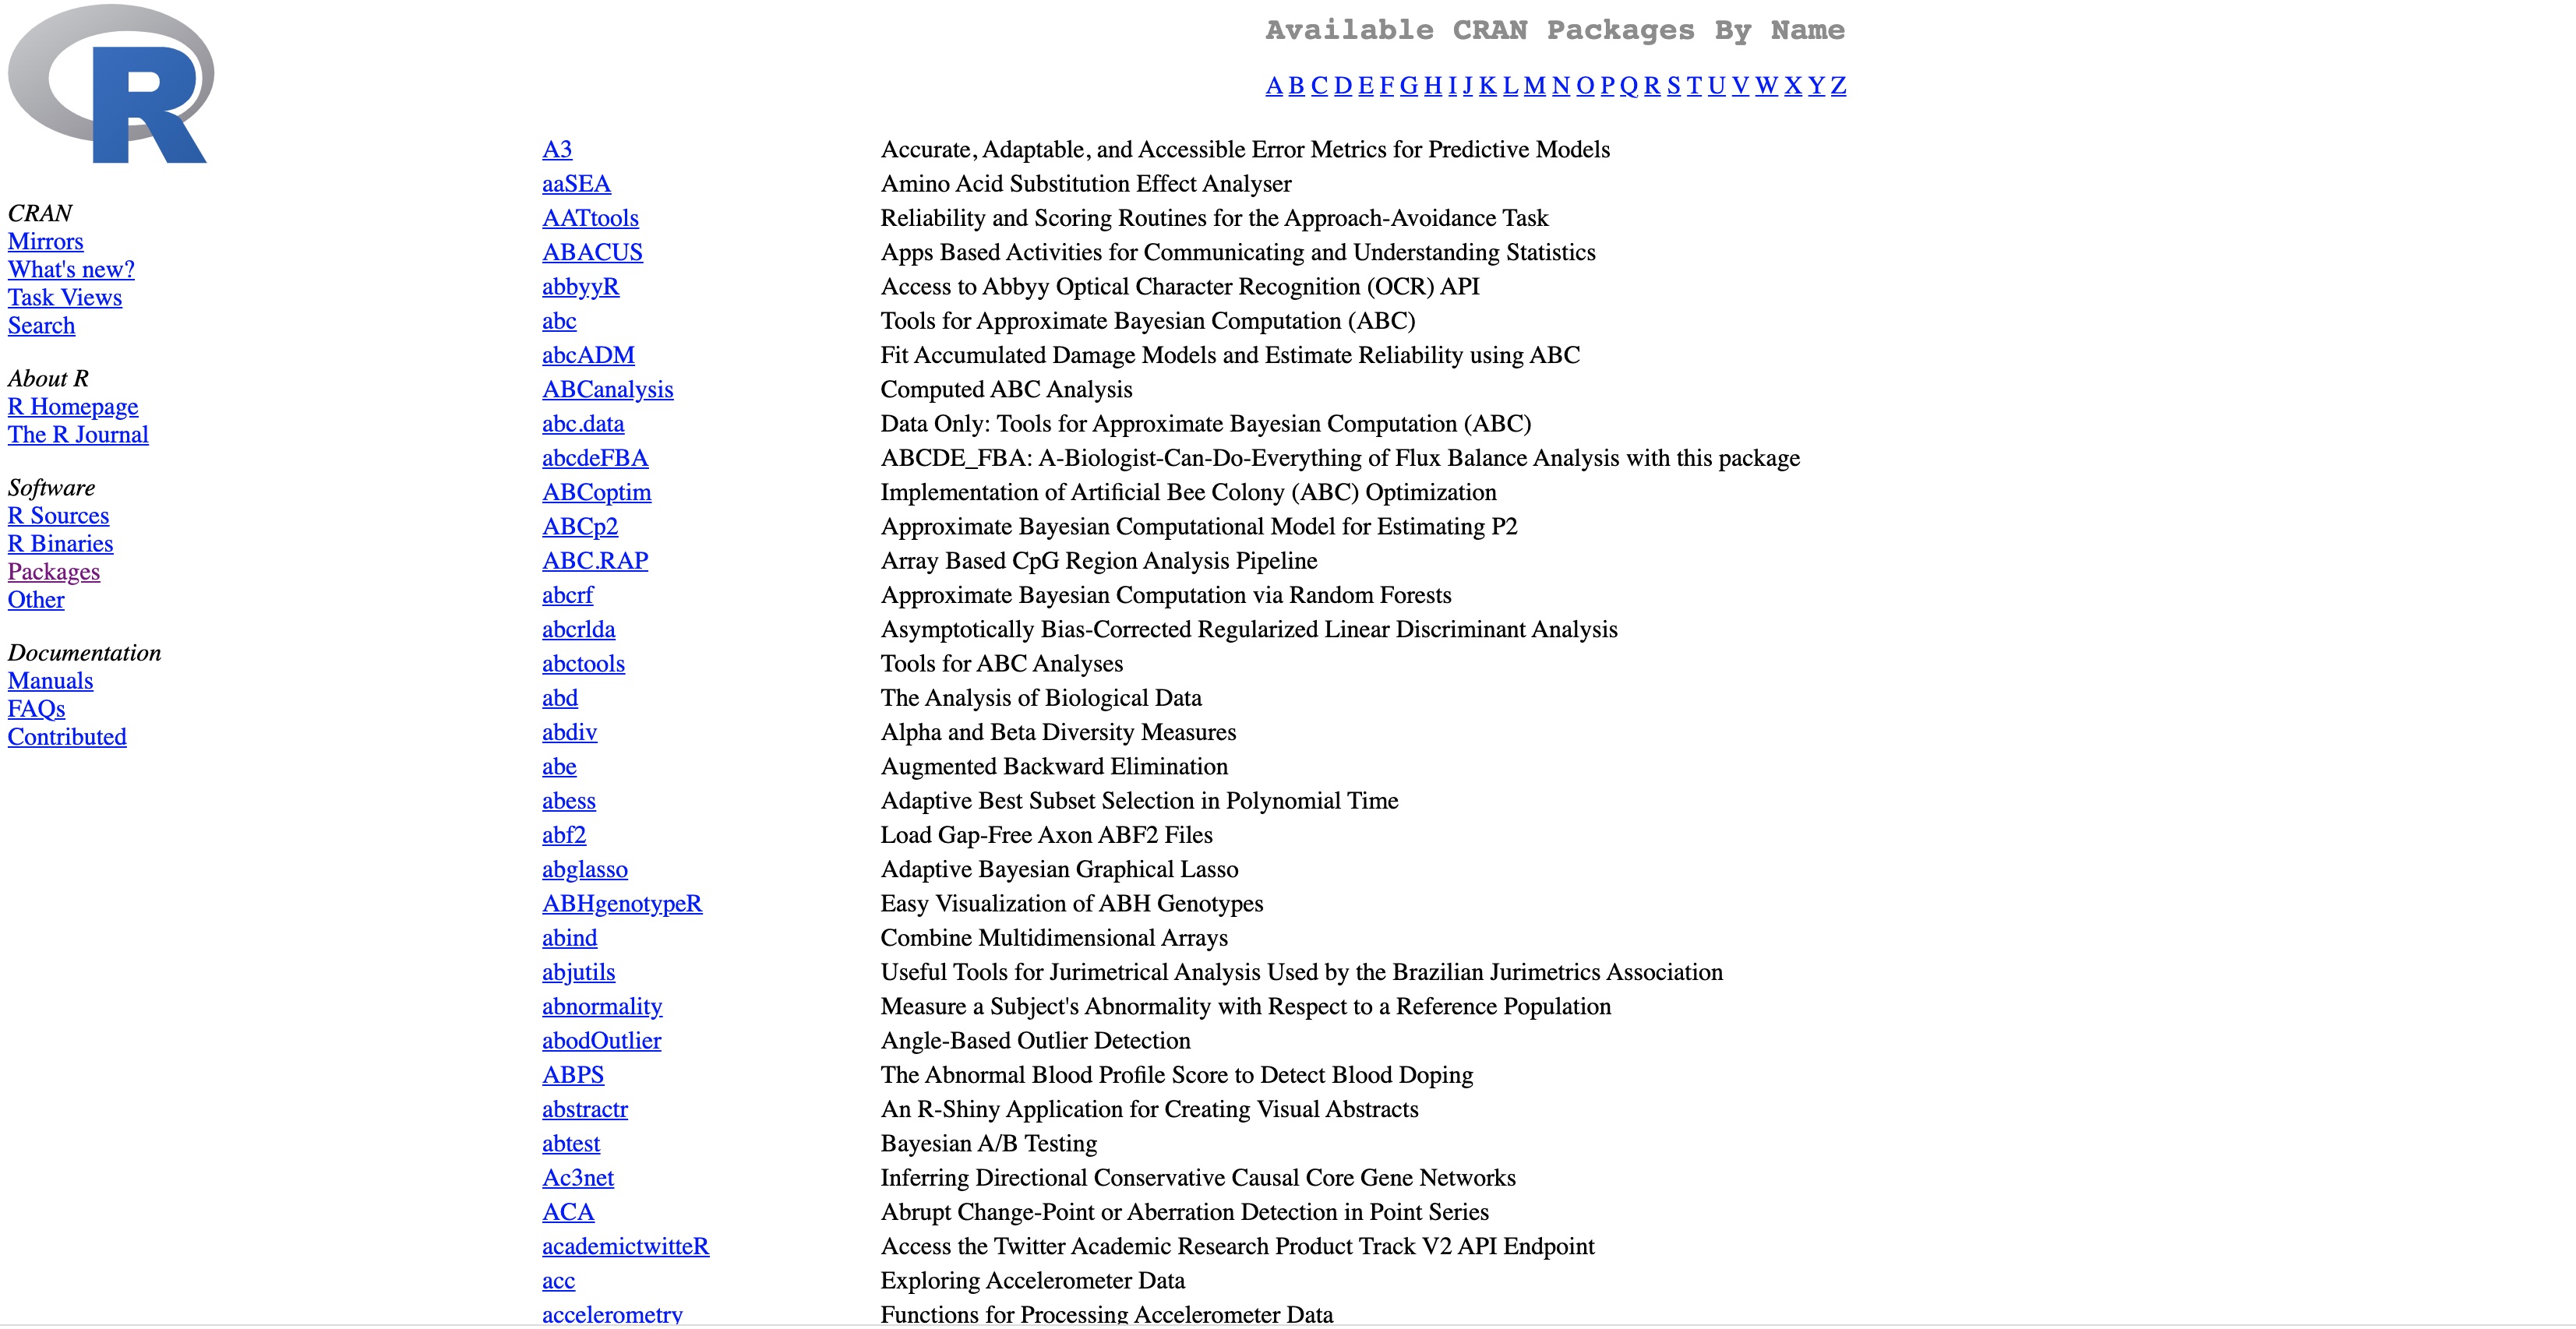
Overview on https://cran.r-project.org/web/packages/available_packages_by_name.html
Which package(s) to use?
install.packages( ) and library( )
Packages can be downloaded and installed
by 'clicking' in
RStudioby using a function in the console or script
What Sven usually does: install.packages()
What Tine usually does: click and go!
For example,
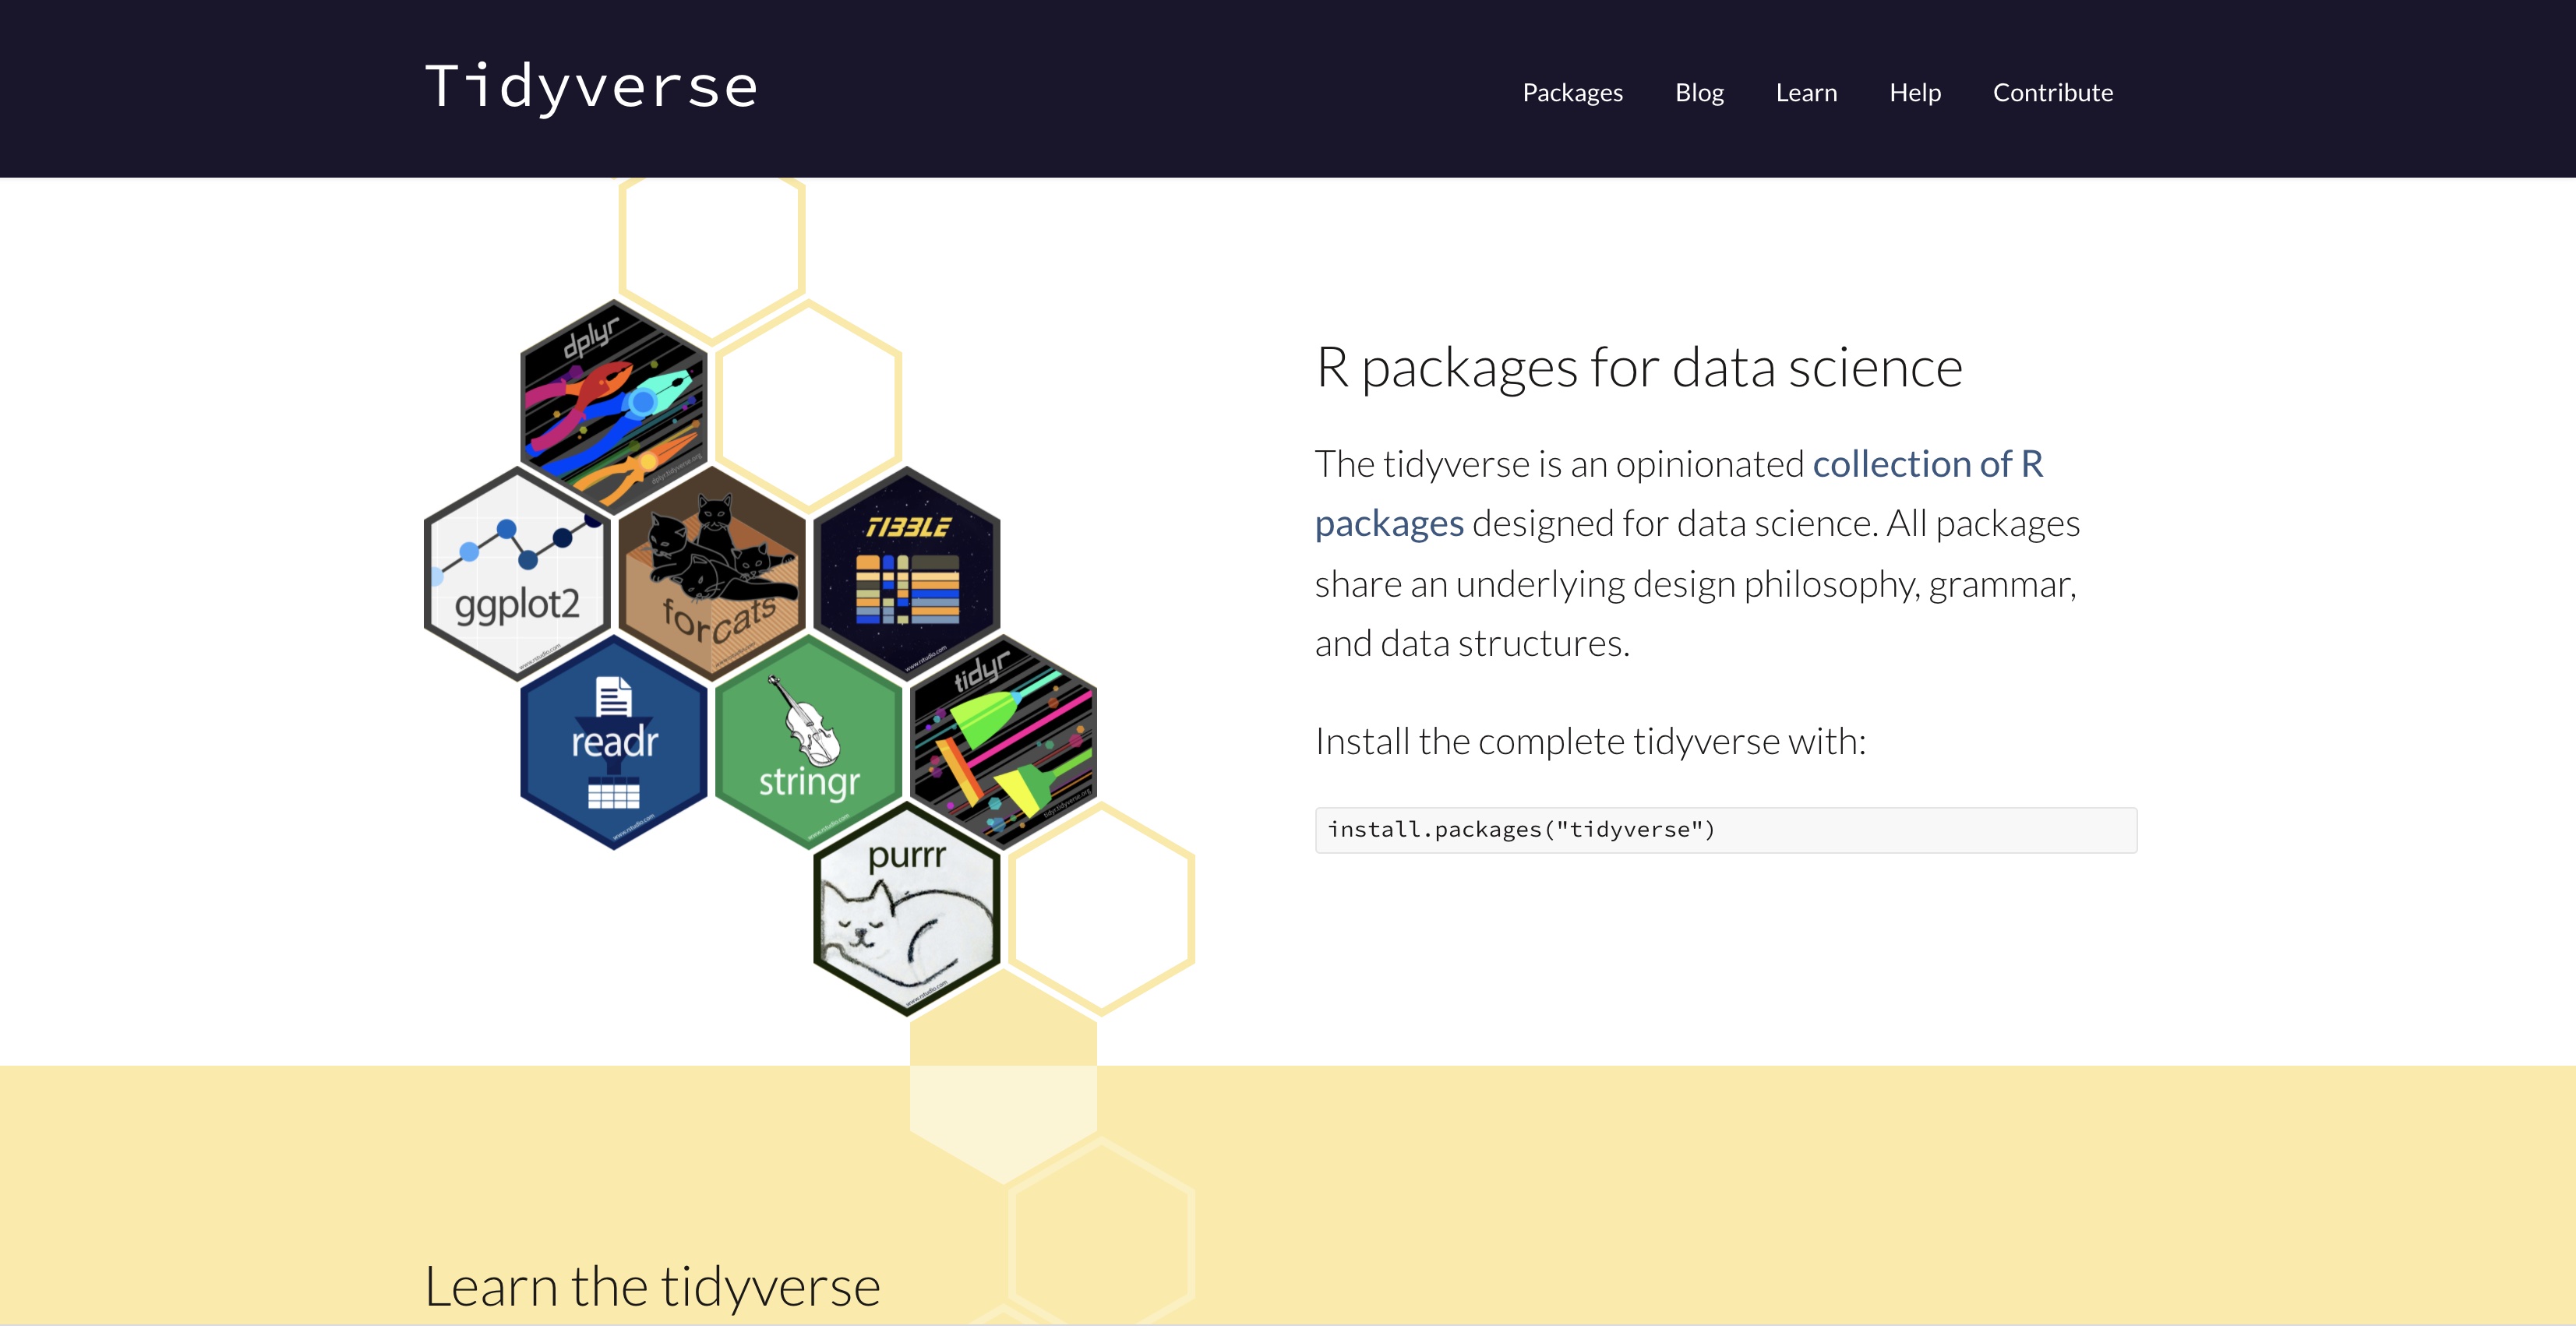
install.packages("tidyverse", dependencies = T)Packages should be activated at the start of the session
by 'clicking' in
RStudioby using a function in de console or script
What we both usually do: library()
For example,
library("tidyverse")7. Working with R-projects
Handling all these files
During analyses, we will regularly handle different files:
- data sets
- scripts
- output (html-files; figures; ...)
Consequently, we should refer to these files in our code.
Taking the right path ...
There are two ways to refer to these files.
USING ABSOLUTE PATHS
We can do this using an ABSOLUTE path. Below is an example of an absolute path:
'c:/Users/Sven/Mijn Documenten/UAntwerpen/Analyses/ProjectX/R_Script/Analysescript1.R'Absolute paths make it difficult to share your work; you get into trouble when you change laptops; ...
USING RELATIVE PATHS
To avoid these problems, RStudio introduced the concept of an R-Project.
Within a project you can use RELATIVE paths (that starts from the folder in which you save the project).
Below is an example of a relative path:
'~R_Script/Analysescript1.R'Sharing projects?
If I put a project of Sven on my laptop, the RELATIVE paths might get me into trouble.
For example, the Rmd-file 'Slides_part1.Rmd' is located at
'c:/Users/Sven/Dropbox/ICO_R_2022/Presentations/Part 1/Slides_part1.Rmd'
Of course, I do not have the same structure on my laptop...
To facilitate sharing of projects, the package here has been created.
Creating relative paths with function here()
The function here() creates a paths relative to the top-level directory of my laptop.
library(here)here()## [1] "/Users/demaeyer/Documents/Praatjes/Workshops/R Course ICO 2024"here("Presentations", "Part 1", "Slides_part1_Rmd")## [1] "/Users/demaeyer/Documents/Praatjes/Workshops/R Course ICO 2024/Presentations/Part 1/Slides_part1_Rmd"Exercises
Creating a project in RStudio
You can find the folder Exercises at the Github: https://github.com/Sdemaeyer2/R_workshop_ICO2024/. Download this folder and put it somewhere on your laptop.
Creating a project in RStudio
Click on File/New Project...
Next, you can choose:

8. Importing data
Data comes in different formats
Data exist in various formats, but the most common ones are:
- MS Excel
- SPSS / Stata / SAS
- text (csv, tab-delimited)
Various methods and packages have been developed to import these types of data
We will show some possibilities
Importing MS Excel data with the readxl pakket
Make sure that the package is installed on your laptop Then, you can use the code below to import the data
library(readxl)Data <- read_excel( path = "<path to map and file>")Goal: you only want to import the sheet with name Group2 and save it as a data frame Data_Group2
Data_Groep2 <- read_excel( path = "<path to map and file>/Datacollection1.xlsx", sheet = "Group1")sheet if:
- the excel-file only includes 1 sheet
- there are multiple sheets but you only want to import the first one
Importing SPSS data with package foreign
Make sure that the package is installed on your laptop Then, you can use the code below to import the data
library(foreign)Data <- read.spss( file = "<path to map and file>", use.value.labels = FALSE, to.data.frame = TRUE)
use.value.labelsargument:
In SPSS, data is labelled. Do you want these labels to appear in the R data-frame?
For example. Variable with 3 categories: 1 = "Low", 2 = "Average", 3 = "High". These labels are included in the SPSS-file. You can choose to import these labels in the R data frame (use.value.labels = TRUE) or only the numbers 1, 2 and 3 that represent these categories (use.value.labels = FALSE)
Importing csv-files with function read.table( )
csv-files usually look like this (separated by , or ;)
Column1, Column2, Column31, 3, 52, 4, 68, 10, 99To import these data, the function read_table( ) is most convenient...
Data <- read.table( file = "<path to map and file>", header = TRUE, sep = ",", dec = ".")headerargument:
The first row includes column (variable) names or not?separgument:
Which character is used to separate the values in the different columns?decargument:
Which character is used to indicate a decimal point? (Can be a point or a comma)
